 Global| Mar 01 2017
U.S. Construction Spending Falls in January
Summary
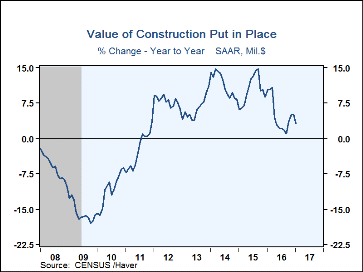
The value of construction put-in-place fell 1.0% in January (+3.1% y/y). This decline did follow upward revisions to December and November, with December now up 0.1% versus -0.2% reported initially, and November up 1.5%, revised from [...]
The value of construction put-in-place fell 1.0% in January (+3.1% y/y). This decline did follow upward revisions to December and November, with December now up 0.1% versus -0.2% reported initially, and November up 1.5%, revised from 0.9%. The latest decline compares to expectations in the Action Economics Forecast Survey for a 0.5% increase.
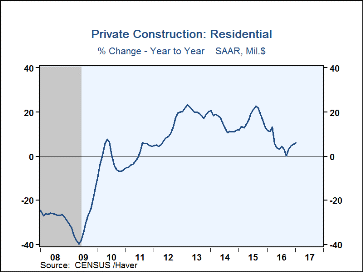
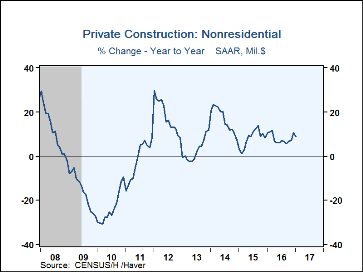
Private sector construction activity increased 0.2% (7.3% y/y) in January after December's 0.5% rise. Residential building grew 0.5% (5.9% y/y) after a 0.7% gain. Multi-family building gained 2.2% (9.0% y/y) after a 0.9% rise. Single-family building was up 1.1% (2.3% y/y) following an 0.8% increase. The value of improvements fell 1.0% (+10.8% y/y) after a 0.4% rise in December. Nonresidential building activity was unchanged in January (+8.9% y/y) following a 0.3% increase. Office construction decreased 0.5% (33.9% y/y), as did commercial construction (11.9% y/y); both had been up markedly in December, offices by 1.7% and commercial, 2.0%. Manufacturing sector construction basically stabilized with a 0.6% rise (-6.8% y/y) after December's 5.3% drop. Power plant construction increased 1.4% (+5.8% y/y) following a 2.1% rise in December.
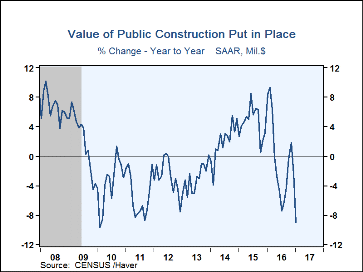
Public sector building activity dropped 5.0% in January (-9.0% y/y) after a 1.4% decrease in December. Declines were widespread. Among the largest categories, educational facility spending was down 2.7% (+1.8% y/y) after a 0.9% decrease in December. Transportation facilities building declined 8.1% (-11.7% y/y), following a modest 0.5% rise in December. And highways and streets, about one-third of total public construction, was down 3.3% in the latest month (-10.1% y/y) after December's 2.7% decline.
The construction spending figures are in Haver's USECON database and the expectations reading is contained in the AS1REPNA database.
| Construction Put in Place (SA, %) | Jan | Dec | Nov | Jan Y/Y | 2016 | 2015 | 2014 |
|---|---|---|---|---|---|---|---|
| Total | -1.0 | 0.1 | 1.5 | 3.1 | 4.9 | 10.3 | 11.4 |
| Private | 0.2 | 0.5 | 2.1 | 7.3 | 6.7 | 12.5 | 15.4 |
| Residential | 0.5 | 0.7 | 2.5 | 5.9 | 5.6 | 16.8 | 14.6 |
| Nonresidential | -0.0 | 0.3 | 1.7 | 8.9 | 7.9 | 8.1 | 16.3 |
| Public | -5.0 | -1.4 | -0.3 | -9.0 | -0.4 | 4.5 | 1.9 |
Carol Stone, CBE
AuthorMore in Author Profile »Carol Stone, CBE came to Haver Analytics in 2003 following more than 35 years as a financial market economist at major Wall Street financial institutions, most especially Merrill Lynch and Nomura Securities. She had broad experience in analysis and forecasting of flow-of-funds accounts, the federal budget and Federal Reserve operations. At Nomura Securities, among other duties, she developed various indicator forecasting tools and edited a daily global publication produced in London and New York for readers in Tokyo. At Haver Analytics, Carol was a member of the Research Department, aiding database managers with research and documentation efforts, as well as posting commentary on select economic reports. In addition, she conducted Ways-of-the-World, a blog on economic issues for an Episcopal-Church-affiliated website, The Geranium Farm. During her career, Carol served as an officer of the Money Marketeers and the Downtown Economists Club. She had a PhD from NYU's Stern School of Business. She lived in Brooklyn, New York, and had a weekend home on Long Island.
More Economy in Brief
 Global| Feb 05 2026
Charts of the Week: Balanced Policy, Resilient Data and AI Narratives
by:Andrew Cates


