 Global| Jun 03 2019
U.S. Construction Spending Unchanged in April; Previous Months Revised Higher
Summary
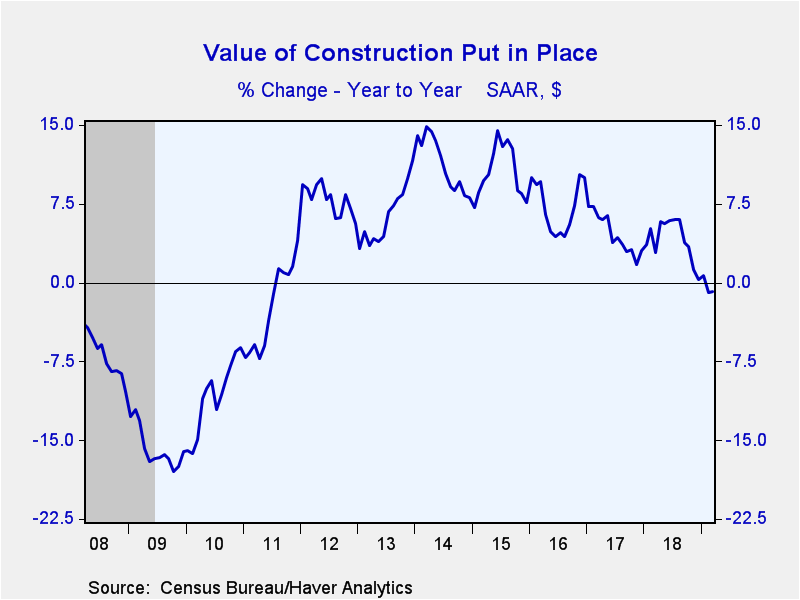
The value of construction put-in-place was flat in April (-1.2% year-on-year) following an upwardly-revised 0.1% gain in March (was -0.9%). February was also revised higher, to 1.0% from 0.7%. The Action Economics Forecast Survey had [...]
The value of construction put-in-place was flat in April (-1.2% year-on-year) following an upwardly-revised 0.1% gain in March (was -0.9%). February was also revised higher, to 1.0% from 0.7%. The Action Economics Forecast Survey had expected a 0.5% rise. Given the positive revisions to previous months, on net, this report was stronger than expected. And, based on this data, the construction spending portion of first quarter GDP is likely to be revised higher. In the first quarter GDP report released last Thursday private construction spending (nonresidential + residential) subtracted 0.1 percentage point from GDP growth.
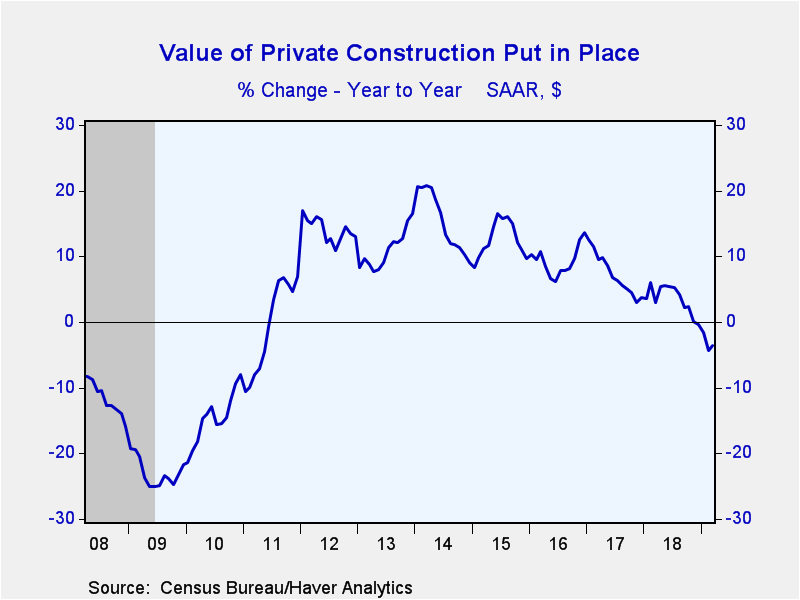
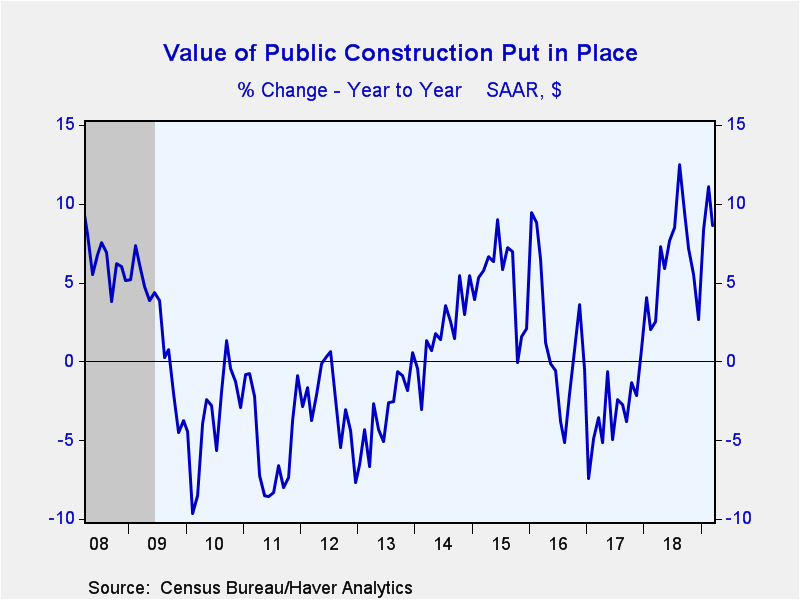
The private and public sectors exhibited significantly different spending patterns. The 1.7% drop in private construction (-6.0% y/y) in April was offset by a 4.8% jump in public spending (+15.1% y/y).
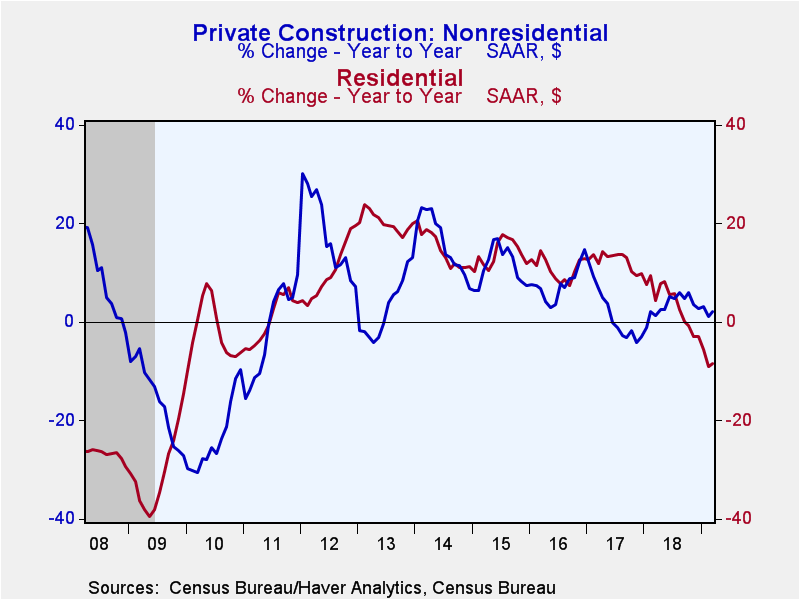
The fall in private spending was concentrated in nonresidential construction (-2.9%; +0.6% y/y). The decline was fairly broad based, though led by 7.2% drop in the volatile manufacturing sector (+11.5% y/y). Residential construction declined 0.6% (-11.4% y/y), with a 2.3% rise in multifamily (+7.9% y/y) offset by a 2.5% decrease in home improvements (-21.7% y/y). Meanwhile, single family activity was an unchanged (-7.6% y/y).
Nonresidential construction, which makes up 98% of public construction, jumped 4.8% in April (15.4% y/y). Construction of highways and streets, the largest category in the public sector, jumped 6.8% (21.3% y/y) after a 21.9% gain in the three months ending in March. Education construction, the second largest category, rose 2.1% (9.6% y/y). Public residential construction grew 4.6% (-0.6% y/y).
The construction spending figures, some of which date back to 1946, are in Haver's USECON database. The expectations reading can be found in the AS1REPNA database.
| Construction Put in Place (SA, %) | Apr | Mar | Feb | Apr Y/Y | 2018 | 2017 | 2016 |
|---|---|---|---|---|---|---|---|
| Total | 0.0 | 0.1 | 1.0 | -1.2 | 3.9 | 4.5 | 7.0 |
| Private | -1.7 | 0.0 | 0.1 | -6.0 | 3.1 | 7.1 | 9.2 |
| Residential | -0.6 | -1.2 | -0.7 | -11.4 | 2.8 | 12.4 | 10.7 |
| Nonresidential | -2.9 | 1.3 | 0.9 | 0.6 | 3.4 | 1.3 | 7.7 |
| Public | 4.8 | 0.5 | 3.9 | 15.1 | 6.4 | -3.2 | 0.7 |
Gerald D. Cohen
AuthorMore in Author Profile »Gerald Cohen provides strategic vision and leadership of the translational economic research and policy initiatives at the Kenan Institute of Private Enterprise.
He has worked in both the public and private sectors focusing on the intersection between financial markets and economic fundamentals. He was a Senior Economist at Haver Analytics from January 2019 to February 2021. During the Obama Administration Gerald was Deputy Assistant Secretary for Macroeconomic Analysis at the U.S. Department of Treasury where he helped formulate and evaluate the impact of policy proposals on the U.S. economy. Prior to Treasury, he co-managed a global macro fund at Ziff Brothers Investments.
Gerald holds a bachelor’s of science from the Massachusetts Institute of Technology and a Ph.D. in Economics from Harvard University and is a contributing author to 30-Second Money as well as a co-author of Political Cycles and the Macroeconomy.
More Economy in Brief
 Global| Feb 05 2026
Charts of the Week: Balanced Policy, Resilient Data and AI Narratives
by:Andrew Cates


