 Global| Sep 25 2007
U.S. Consumer Confidence Drops Off Sharply
Summary
With the September Conference Board report we have a bit more of a dilemma on our hands. While the August job report was very weak as the month went on consumer confidence did not weaken from its earliest readings which were [...]
With the September Conference Board report we have a bit more of a dilemma on our hands. While the August job report was very weak as the month went on consumer confidence did not weaken from its earliest readings which were themselves weak. Both the weekly consumer comfort gauge and the preliminary University of Michigan report showed a firming in confidence that has continued. Now, in September, we get a big drop in confidence, the second in a row from the Conference Board measure. Neither the University of Michigan preliminary reading nor the weekly consumer comfort reports are in early agreement with this weakness. Moreover, the weekly jobless claims are lower despite the fact that the Conference Board report is supposed to be more labor-market centric than the others. We are left to ponder which of these reports really has the pulse of the nation and which of them has glommed onto pulse of the family dog.
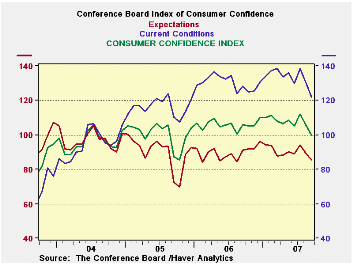
The range data on the detailed components of the Conference Board index show us that this weakness is fairly widespread across expectations in the report.
Expectations are the weakest readings residing in the middle of their range at the 48th percentile. The present situation comes out in the top 25 percent of the range - nearly the top 20%.
Between the two present situation readings, the business conditions response is the weaker in its range at the 53 percent mark while employment is near the top 30% of its range.
Among the expectations components both the business and employment indexes are weak in their respective ranges, bottom 35% to 40%. But income, a more stable component, is holding up in the top third of its range.
The planned spending components are exceptionally weak. Plans to buy an automobile are in the bottom 15% of their range; plans to buy a house are in the bottom 5% of their range.
The Conference Board reading is weak. It is at its weakest point since an unusually sharp drop late in 2005. Since other measures have not gone along with this one, we will want to watch closely if the Conference Board is isolated or just early in its report of weakness.
| Table of Comparison for Conference Board Survey | |||||
|---|---|---|---|---|---|
| Overall Index | Current | Max | Min | Year Ago | Pctile |
| Confidence Index | 99.8 | 111.9 | 61.4 | 105.9 | 76.0% |
| Present Situation | 121.7 | 138.5 | 59.7 | 128.3 | 78.7% |
| Expectations | 85.2 | 110.2 | 61.4 | 91.0 | 48.8% |
| Present Situation | Current | Max/Oct'03 | Min/Oct'03 | Year Ago | Pctile |
| Business Conditions | 53.9 | 57.3 | 50.0 | 55.9 | 53.4% |
| Good | 25.7 | 29.7 | 13.6 | 27.3 | 75.2% |
| Bad | 17.9 | 31.0 | 14.5 | 15.6 | 20.6% |
| Normal | 56.4 | 61.5 | 53.1 | 57.1 | 39.3% |
| Employment | 51.8 | 55.7 | 43.2 | 52.7 | 68.9% |
| Jobs Plentiful | 25.7 | 30.3 | 9.9 | 26.2 | 77.5% |
| Not so Plentiful | 52.2 | 60.2 | 50.7 | 52.9 | 15.8% |
| Jobs Hard To Get | 22.1 | 35.1 | 17.9 | 20.9 | 24.4% |
| Expectations(6-mo) | Current | Max | Min | Year Ago | Pctile |
| Business Conditions | 51.9 | 58.0 | 47.8 | 53.1 | 40.4% |
| Better | 15.6 | 28.0 | 13.0 | 16.5 | 17.3% |
| Worsen | 11.8 | 20.0 | 6.2 | 10.3 | 40.6% |
| Same | 72.6 | 76.7 | 65.0 | 73.2 | 65.0% |
| Employment | 47.3 | 53.0 | 44.2 | 49.1 | 35.6% |
| More Jobs | 13.3 | 22.2 | 10.8 | 14.7 | 21.9% |
| Fewer Jobs | 18.7 | 28.5 | 13.5 | 16.5 | 34.7% |
| The Same | 68.0 | 72.5 | 59.1 | 68.8 | 66.4% |
| Income | 55.9 | 57.1 | 53.4 | 55.7 | 68.5% |
| Increase | 20.4 | 22.7 | 15.8 | 20.2 | 66.7% |
| Decrease | 8.6 | 13.4 | 7.2 | 8.8 | 22.6% |
| Same | 71.0 | 74.5 | 67.8 | 71.0 | 47.8% |
| Buying Plans: | |||||
| Automobile | Current | Max | Min | Year Ago | Pctile |
| Yes | 5.2 | 8.7 | 4.6 | 6.0 | 14.6% |
| New | 2.7 | 4.3 | 2.1 | 2.9 | 27.3% |
| House | Current | Max | Min | Year Ago | Pctile |
| Yes | 2.7 | 4.5 | 2.6 | 2.9 | 5.3% |
| New | 0.7 | 1.7 | 0.5 | 1.0 | 16.7% |
| Major Appliance | 29.7 | 35.3 | 25.0 | 27.5 | 45.6% |
| Buying index | 81.4 | 107.7 | 74.3 | 98.4 | 21.3% |
| New Purchase Index | 76.5 | 107.9 | 61.6 | 94.3 | 32.2% |
| From Dec '01 'til | Sep-07 | ||||

Robert Brusca
AuthorMore in Author Profile »Robert A. Brusca is Chief Economist of Fact and Opinion Economics, a consulting firm he founded in Manhattan. He has been an economist on Wall Street for over 25 years. He has visited central banking and large institutional clients in over 30 countries in his career as an economist. Mr. Brusca was a Divisional Research Chief at the Federal Reserve Bank of NY (Chief of the International Financial markets Division), a Fed Watcher at Irving Trust and Chief Economist at Nikko Securities International. He is widely quoted and appears in various media. Mr. Brusca holds an MA and Ph.D. in economics from Michigan State University and a BA in Economics from the University of Michigan. His research pursues his strong interests in non aligned policy economics as well as international economics. FAO Economics’ research targets investors to assist them in making better investment decisions in stocks, bonds and in a variety of international assets. The company does not manage money and has no conflicts in giving economic advice.
More Economy in Brief

 Global| Feb 05 2026
Charts of the Week: Balanced Policy, Resilient Data and AI Narratives
by:Andrew Cates

