 Global| Sep 08 2016
U.S. Consumer Confidence Improves Broadly
by:Sandy Batten
|in:Economy in Brief
Summary
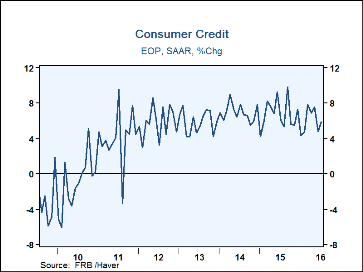
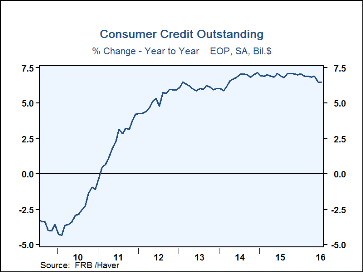
Consumer credit outstanding picked up in July, increasing $17.7 billion (6.0% y/y) during the month versus an upwardly revised, though still subpar, $14.5 billion (initially $12.3 billion) rise in June. The previously reported May [...]
Consumer credit outstanding picked up in July, increasing $17.7 billion (6.0% y/y) during the month versus an upwardly revised, though still subpar, $14.5 billion (initially $12.3 billion) rise in June. The previously reported May increase was also revised up, rather significantly, to a $22.6 billion increase from $17.9 billion. A $15.1 billion increase had been expected in the Action Economics Forecast Survey. Over the past ten years, there has been a 46% correlation between the y/y growth in consumer credit and y/y growth in personal consumption expenditures.
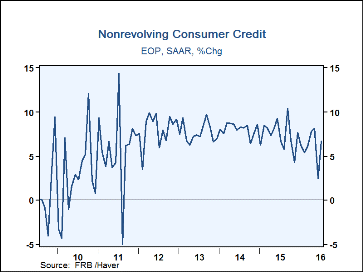
Nonrevolving credit led the July rise, increasing $14.9 billion (6.1% y/y) after an upwardly revised $5.4 billion gain in June. The June increase is still the smallest dollar increase since December. Federal government loans (37% of the total) increased 11.2% y/y. Finance company balances (23% of the total) eased 2.1% y/y. Borrowing from depository institutions (25% of the total) improved 5.6% y/y, and borrowing from credit unions (12% of the total) jumped 11.3% y/y.
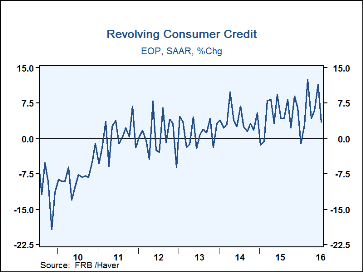
Revolving consumer credit edged up $2.8 billion (5.9% y/y) in July, its smallest monthly increase since February. But the initially reported $7.7 billion for June was revised up to $9.2 billion. Balances at depository institutions (84% of the total) grew 8.3% y/y. Finance company holdings (6% of the total) fell 6.8% y/y, while borrowing from credit unions (5% of the total) advanced 8.5% y/y.
These Federal Reserve Board figures are break-adjusted and calculated by Haver Analytics. There is a break in the credit outstanding data from November 2010 to December 2010 due to the Fed's benchmarking process. Benchmark estimates are based on the Census of Finance Companies (CFC) and the Survey of Finance Companies (SFC) conducted in 2010 and 2011, respectively.
The Consumer Confidence data is available in Haver's CBDB database. The total indexes appear in USECON, and the market expectations are in AS1REPNA
| Conference Board (SA, 1985=100) | Aug | Jul | Jun | Y/Y % | 2015 | 2014 | 2013 |
|---|---|---|---|---|---|---|---|
| Consumer Confidence Index | 101.1 | 96.7 | 97.4 | -0.2 | 98.0 | 86.9 | 73.2 |
| Present Situation | 123.0 | 118.8 | 116.6 | 6.2 | 111.7 | 87.4 | 67.6 |
| Expectations | 86.4 | 82.0 | 84.6 | -5.7 | 88.8 | 86.6 | 77.0 |
| Consumer Confidence By Age Group | |||||||
| Under 35 Years | 120.9 | 120.1 | 132.3 | 2.5 | 116.0 | 106.6 | 93.1 |
| Aged 35-54 Years | 112.7 | 104.8 | 104.7 | 2.5 | 103.9 | 92.4 | 76.8 |
| Over 55 Years | 84.7 | 80.9 | 73.9 | -2.4 | 84.1 | 73.8 | 61.2 |
Sandy Batten
AuthorMore in Author Profile »Sandy Batten has more than 30 years of experience analyzing industrial economies and financial markets and a wide range of experience across the financial services sector, government, and academia. Before joining Haver Analytics, Sandy was a Vice President and Senior Economist at Citibank; Senior Credit Market Analyst at CDC Investment Management, Managing Director at Bear Stearns, and Executive Director at JPMorgan. In 2008, Sandy was named the most accurate US forecaster by the National Association for Business Economics. He is a member of the New York Forecasters Club, NABE, and the American Economic Association. Prior to his time in the financial services sector, Sandy was a Research Officer at the Federal Reserve Bank of St. Louis, Senior Staff Economist on the President’s Council of Economic Advisors, Deputy Assistant Secretary for Economic Policy at the US Treasury, and Economist at the International Monetary Fund. Sandy has taught economics at St. Louis University, Denison University, and Muskingun College. He has published numerous peer-reviewed articles in a wide range of academic publications. He has a B.A. in economics from the University of Richmond and a M.A. and Ph.D. in economics from The Ohio State University.
More Economy in Brief
 Global| Feb 05 2026
Charts of the Week: Balanced Policy, Resilient Data and AI Narratives
by:Andrew Cates


