 Global| Dec 27 2012
U.S. Consumer Confidence Turns Down
Summary
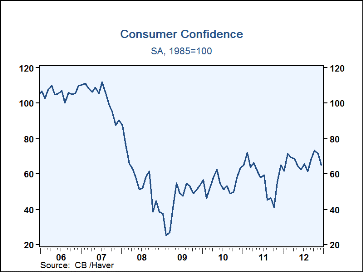
The Conference Board's Consumer Confidence Index for December fell 6.4 points to 65.1 (1985=100) from 71.5 in November. That figure was itself revised down 2.2 points from 73.7 reported a month ago. Consensus expectations had called [...]
 The Conference Board's Consumer Confidence Index for December fell 6.4 points to 65.1 (1985=100) from 71.5 in November. That figure was itself revised down 2.2 points from 73.7 reported a month ago. Consensus expectations had called for a modest decrease to 71.0 for December.
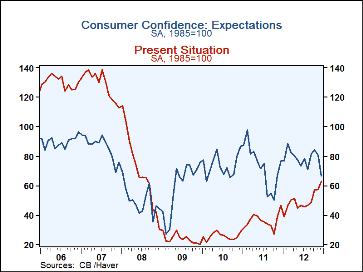
The "Present Situation" components actually moved favorably, to 62.8 from 57.4 in November; the December value was the highest since August 2008. Participants' assessment of general business conditions improved with an increase in the number of people seeing them as "good" and a sizable decrease in the number describing business as "bad". Employment conditions improved on balance; even though the number finding jobs plentiful went down a bit, those describing jobs as "hard to get" fell 1.8%, a third successive decrease.
So the drop in the overall confidence measure is due to lower "Expectations". Indeed, that subindex fell 14.4 points to 66.5, the lowest since November 2011 and down 17.5 points in just the last two months. There were adverse movements in the assessments of general business expectations, employment and income, in which the proportions of respondents looking for better business, more jobs and higher income all fell, while the proportions anticipating slower business, fewer jobs and lower incomes all rose, these latter by several points each.
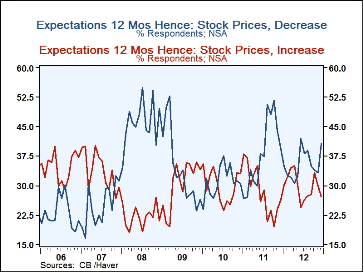
Expectations for inflation in the next 12 months were unchanged at 5.6%. The move in the overall expectations index was reflected in expectations for the stock market, with a 2.6% decrease in the share of people looking for higher prices in the next 12 months and a 7.4% increase in the share expecting lower stock prices. The percentage of respondents planning to buy a home within six months fell again, and so did the proportion planning to buy major appliances. However, the share expecting to buy an automobile edged up modestly, erasing part of its November loss.
Headline figures on consumer confidence are carried in Haver's USECON database. The Conference Board's detailed data are found in Haver's CBDB database, and the consensus expectations figure is from Actions Economics, as tabulated in the AS1REPNA database.
| Conference Board (SA, 1985=100) | |||||||
|---|---|---|---|---|---|---|---|
| Dec | Nov | Oct | Y/Y % | 2012 | 2011 | 2010 | |
| Consumer Confidence Index | 65.1 | 71.5 | 73.1 | 0.5 | 66.9 | 58.1 | 54.5 |
| Present Situation | 62.8 | 57.4 | 56.7 | 35.1 | 49.6 | 36.2 | 25.7 |
| Expectations | 66.5 | 80.9 | 84.0 | -13.6 | 78.4 | 72.8 | 73.7 |
Carol Stone, CBE
AuthorMore in Author Profile »Carol Stone, CBE came to Haver Analytics in 2003 following more than 35 years as a financial market economist at major Wall Street financial institutions, most especially Merrill Lynch and Nomura Securities. She had broad experience in analysis and forecasting of flow-of-funds accounts, the federal budget and Federal Reserve operations. At Nomura Securities, among other duties, she developed various indicator forecasting tools and edited a daily global publication produced in London and New York for readers in Tokyo. At Haver Analytics, Carol was a member of the Research Department, aiding database managers with research and documentation efforts, as well as posting commentary on select economic reports. In addition, she conducted Ways-of-the-World, a blog on economic issues for an Episcopal-Church-affiliated website, The Geranium Farm. During her career, Carol served as an officer of the Money Marketeers and the Downtown Economists Club. She had a PhD from NYU's Stern School of Business. She lived in Brooklyn, New York, and had a weekend home on Long Island.
More Economy in Brief
 Global| Feb 05 2026
Charts of the Week: Balanced Policy, Resilient Data and AI Narratives
by:Andrew Cates


