 Global| Sep 08 2015
U.S. Consumer Credit Growth Pulls Back
Summary
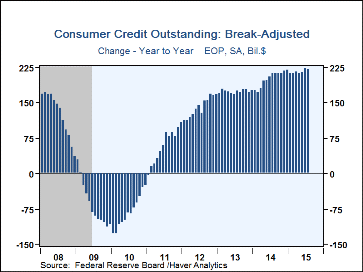
Consumer credit outstanding increased $19.1 billion during July after rising $27.0 billion in June, which was revised noticeably from $20.7 billion reported before. July expectations were for an $18.0 billion increase, according to [...]
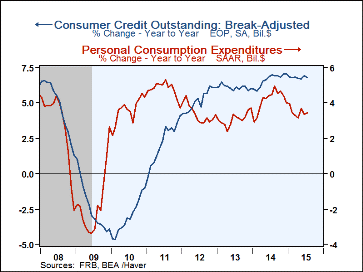
Consumer credit outstanding increased $19.1 billion during July after rising $27.0 billion in June, which was revised noticeably from $20.7 billion reported before. July expectations were for an $18.0 billion increase, according to the Action Economics Forecast Survey. Both revolving and nonrevolving credit contributed to the slower July result. During the last ten years, there has been a 47% correlation between the y/y growth in consumer credit and y/y growth in personal consumption expenditures.
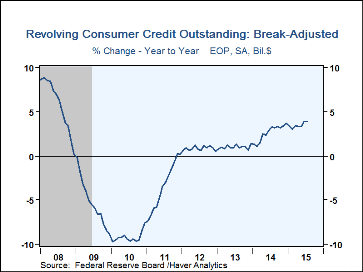
Revolving consumer credit rose $4.3 billion in July (3.9% y/y), following June's upwardly revised $7.5 billion gain. Depository institution balances (82% of the total) increased 5.4% y/y. Finance company lending (6.5% of the total) declined 7.1% y/y and borrowing from credit unions (5% of the total) gained 6.2% y/y. Nonfinancial business credit (3% of the total) was up 0.2% y/y and securitized credit card balances (3% of the total) fell 0.9% y/y.
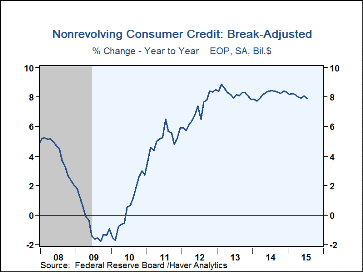
Nonrevolving credit borrowing in July was $14.8 billion (7.9% y/y), less than June's $19.5 billion. Federal government loans, 35.5% of the total, increased 13.4% y/y. Finance company balances (25% of the total) improved 2.2% y/y. Borrowing at banks (also 25% of the total) rose 4.6% y/y and borrowing at credit unions (11% of the total) advanced 15.3% y/y. Nonprofit & educational institution loans (2% of the total) declined 11.9% y/y, and nonfinancial business loans (1% of the total) remained unchanged y/y.
The upward revision to June's borrowing was reflected in second quarter results for student loan balances, which were up 7.2% y/y instead of 6.7% y/y reported before and borrowing for motor vehicle purchases was mildly stronger, up 8.6% versus the earlier 8.3% y/y.
These Federal Reserve Board figures are break-adjusted and calculated by Haver Analytics. There is a break in the credit outstanding data from November 2010 to December 2010 due to the Fed's benchmarking process. Benchmark estimates are based on the Census of Finance Companies (CFC) and the Survey of Finance Companies (SFC) conducted in 2010 and 2011, respectively.
The consumer credit data are available in Haver's USECON database. The Action Economics figures are contained in the AS1REPNA database.
| Consumer Credit Outstanding (M/M Chg, SA) | Jul | Jun | May | Y/Y | 2014 | 2013 | 2012 |
|---|---|---|---|---|---|---|---|
| Total | $19.1 bil. | $27.0 bil. | $19.7 bil. | 6.8% | 7.0% | 6.0% | 6.1% |
| Revolving | 4.3 | 7.5 | 2.5 | 3.9 | 3.7 | 1.4 | 0.6 |
| Nonrevolving | 14.8 | 19.5 | 7.2 | 7.9 | 8.3 | 7.9 | 8.5 |
Carol Stone, CBE
AuthorMore in Author Profile »Carol Stone, CBE came to Haver Analytics in 2003 following more than 35 years as a financial market economist at major Wall Street financial institutions, most especially Merrill Lynch and Nomura Securities. She had broad experience in analysis and forecasting of flow-of-funds accounts, the federal budget and Federal Reserve operations. At Nomura Securities, among other duties, she developed various indicator forecasting tools and edited a daily global publication produced in London and New York for readers in Tokyo. At Haver Analytics, Carol was a member of the Research Department, aiding database managers with research and documentation efforts, as well as posting commentary on select economic reports. In addition, she conducted Ways-of-the-World, a blog on economic issues for an Episcopal-Church-affiliated website, The Geranium Farm. During her career, Carol served as an officer of the Money Marketeers and the Downtown Economists Club. She had a PhD from NYU's Stern School of Business. She lived in Brooklyn, New York, and had a weekend home on Long Island.
More Economy in Brief
 Global| Feb 05 2026
Charts of the Week: Balanced Policy, Resilient Data and AI Narratives
by:Andrew Cates


