 Global| Sep 09 2013
U.S. Consumer Credit Usage Moderates A Bit in July
Summary
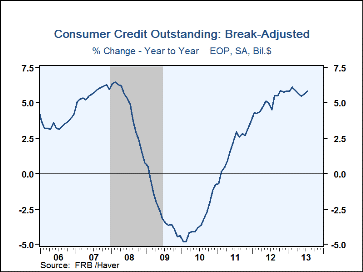
Consumers increased their credit outstanding by $10.4 billion in July, yielding growth of 5.9% year-on-year. This is modestly less than the $12.5 billion expected in the Action Economics consensus survey and less than the $11.9 [...]
 Consumers increased their credit outstanding by $10.4 billion in July, yielding growth of 5.9% year-on-year.
This is modestly less than the $12.5 billion expected in the Action Economics consensus survey and less than the $11.9 billion increase in June.
That latter figure was itself revised down from $13.8 billion reported initially.
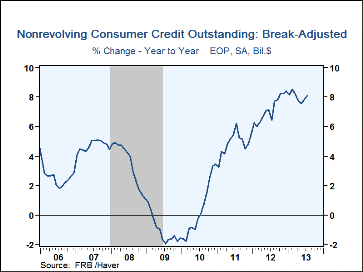
The slowdown took place in non-revolving credit, as it went up $12.3 billion in July (8.1% year/year) compared to $15.5 billion in June, which was originally reported at $16.5 billion. Federal government loans were up 21.2% y/y, these constitute about 29% of total non-revolving credit. Finance company lending (31% of the total) edged up 0.5% y/y and commercial bank consumer loans (27% of the total) gained 6.0% y/y. Borrowing at credit unions (11% of the total) advanced 8.5% y/y while savings institutions credit (2% of the total) rose 3.3% y/y.
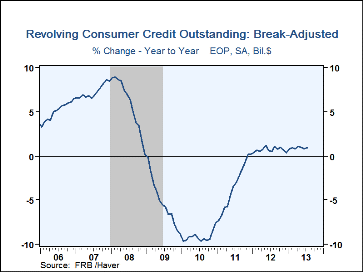
Revolving credit declined again in July, by $1.8 billion (+0.9% y/y) in July, although this was mildly less than June's $3.7 billion decrease. That figure was revised modestly downward from $2.7 billion reported before. About 73% of this credit is held by commercial banks and that rose 0.5% y/y. Savings institution credit card accounts (8% of the total) gained 8.7% y/y. Finance company accounts (8% of the total) fell 1.5% y/y while borrowing from credit unions (5% of the total) gained 8.5% y/y. Nonfinancial business accounts (3% of the total) fell 19.5% y/y and securitized credit card balances (4% of the total) gained 8.9%.
The figures used in this report are break-adjusted and calculated by Haver Analytics. There is a break in the credit outstanding data from November 2010 to December 2010 due to the Fed's benchmarking process. Benchmark estimates are based on the Census of Finance Companies (CFC) and the Survey of Finance Companies (SFC) conducted in 2010 and 2011, respectively. The consumer credit data are available in Haver's USECON database. The Action Economics figures are contained in the AS1REPNA database.
| Consumer Credit Outstanding (M/M Chg, SA) | Jul | Jun | May | Y/Y | 2012 | 2011 | 2010 |
|---|---|---|---|---|---|---|---|
| Total | $10.4B | $11.9B | $16.0B | 5.9% | 5.8% | 3.7% | -0.7% |
| Revolving | -1.8 | -3.7 | 6.0 | 0.9 | 0.4 | 0.2 | -7.5 |
| Non-revolving | 12.3 | 15.5 | 10.0 | 8.1 | 8.4 | 5.5 | 3.4 |
Carol Stone, CBE
AuthorMore in Author Profile »Carol Stone, CBE came to Haver Analytics in 2003 following more than 35 years as a financial market economist at major Wall Street financial institutions, most especially Merrill Lynch and Nomura Securities. She had broad experience in analysis and forecasting of flow-of-funds accounts, the federal budget and Federal Reserve operations. At Nomura Securities, among other duties, she developed various indicator forecasting tools and edited a daily global publication produced in London and New York for readers in Tokyo. At Haver Analytics, Carol was a member of the Research Department, aiding database managers with research and documentation efforts, as well as posting commentary on select economic reports. In addition, she conducted Ways-of-the-World, a blog on economic issues for an Episcopal-Church-affiliated website, The Geranium Farm. During her career, Carol served as an officer of the Money Marketeers and the Downtown Economists Club. She had a PhD from NYU's Stern School of Business. She lived in Brooklyn, New York, and had a weekend home on Long Island.
More Economy in Brief
 Global| Feb 05 2026
Charts of the Week: Balanced Policy, Resilient Data and AI Narratives
by:Andrew Cates


