Global| Nov 23 2005
U.S. Consumer Sentiment Lifted Further By Drop in Oil Prices
by:Tom Moeller
|in:Economy in Brief
Summary
The November reading of consumer sentiment from the University of Michigan rose 10.0% m/m to 81.6, adding a bit to the improvement through mid-month. Consensus expectations had been for a rise to 81.0. During the last ten years there [...]
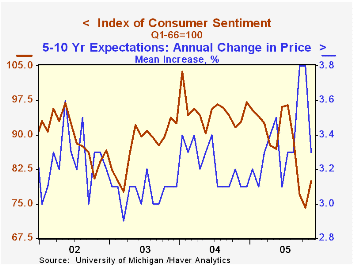
The November reading of consumer sentiment from the University of Michigan rose 10.0% m/m to 81.6, adding a bit to the improvement through mid-month. Consensus expectations had been for a rise to 81.0.
During the last ten years there has been a 78% correlation between the level of consumer sentiment and the y/y change in real consumer spending.
Improved expectations fostered the m/m rise. The index of Consumer expectations rose 10.1% as expected business conditions during the next year surged 22.1% while expectations for personal finances recovered all of the prior month's drop. The mean expected inflation rate for the next twelve months fell further to 4.1% from 5.5% expected in October & September.
The current conditions index held onto the improvement through mid-month and rose 9.9% versus October. The reading of personal finances rose 7.3% and reversed all of the October decline and the reading of buying conditions for large household goods jumped 12.9% to the highest level since August.
The University of Michigan survey is not seasonally adjusted.The mid-month survey is based on telephone interviews with 250 households nationwide on personal finances and business and buying conditions. The survey is expanded to a total of 500 interviews at month end.
Why Hasn't the Jump in Oil Prices Led to a Recession? from the Federal Reserve Bank of San Francisco is available here.
| University of Michigan | Nov (Final) | Nov (Prelim) | Oct | Y/Y | 2004 | 2003 | 2002 |
|---|---|---|---|---|---|---|---|
| Consumer Sentiment | 81.6 | 79.9 | 74.2 | -12.1% | 95.2 | 87.6 | 89.6 |
| Current Conditions | 100.2 | 100.3 | 91.2 | -4.3% | 105.6 | 97.2 | 97.5 |
| Expectations | 69.6 | 66.8 | 63.2 | -18.3% | 88.5 | 81.4 | 84.6 |
by Tom Moeller November 23, 2005
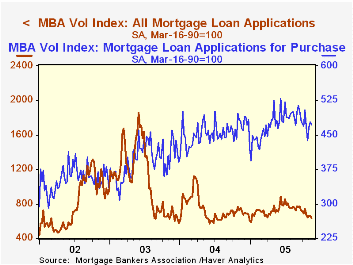
The total number of mortgage applications dropped 3.4% last week to the lowest level since January, according to the Mortgage Bankers Association. The decline pulled the average level in November 5.5% below October.
Applications to refinance, down 6.9%, fell sharply for the fifth consecutive week. The November average is down 14.0% from October.
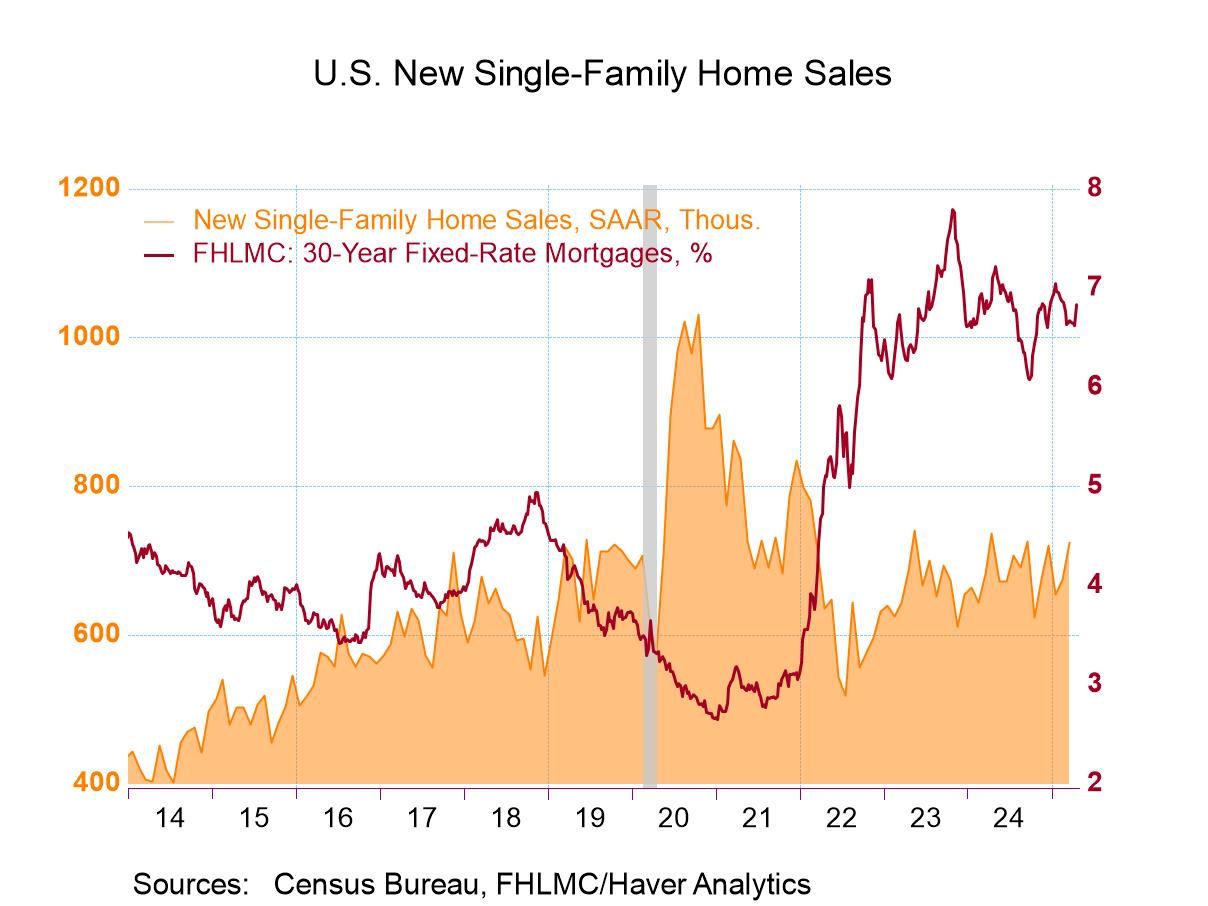
Purchase applications fell 1.2% and reversed about half of the prior week's gain. Purchase applications in November are 0.6% ahead of October. During the last ten years there has been a 49% correlation between the y/y change in purchase applications and the change in new plus existing single family home sales.
The effective interest rate on a conventional 30-year mortgage slipped to 6.48% from 6.59% the prior week. The effective rate on a 15-year mortgage also fell to 6.11% from 6.18%. The interest rates on 15 and 30 year mortgages are closely correlated (>90%) with the rate on 10 year Treasury securities.
The Mortgage Bankers Association surveys between 20 to 35 of the top lenders in the U.S. housing industry to derive its refinance, purchase and market indexes. The weekly survey accounts for more than 40% of all applications processed each week by mortgage lenders. Visit the Mortgage Bankers Association site here.
Can U.S. Monetary Policy Fall (Again) into an Expectation Trap? from the Federal Reserve Bank of New York can be found here.
| MBA Mortgage Applications (3/16/90=100) | 11/18/05 | 11/11/05 | Y/Y | 2004 | 2003 | 2002 |
|---|---|---|---|---|---|---|
| Total Market Index | 635.4 | 657.6 | -11.1% | 735.1 | 1,067.9 | 799.7 |
| Purchase | 472.3 | 477.9 | 1.9% | 454.5 | 395.1 | 354.7 |
| Refinancing | 1,584.1 | 1,702.4 | -27.3% | 2,366.8 | 4,981.8 | 3,388.0 |
by Tom Moeller November 23, 2005
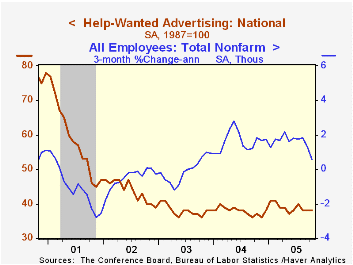
The Conference Board's Index of Help-Wanted Advertising held at 38 in October versus the downwardly revised September level and 38 in August. The average level so far this year is 39.
During the last ten years there has been a 62% correlation between the level of help-wanted advertising and the three month change in non-farm payrolls.
The proportion of labor markets with rising want-ad volume improved further to 57% in October after gains during the prior two months.
The Conference Board surveys help-wanted advertising volume in 51 major newspapers across the country every month.
The latest help wanted report from the Conference Board is available here.
| Conference Board | Oct | Sept | Oct '04 |
|---|---|---|---|
| National Help Wanted Index | 38 | 38 | 36 |
by Tom Moeller November 23, 2005
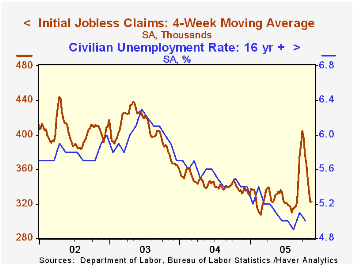
Initial claims for unemployment insurance rose 30,000 to 335,000 last week and reversed the little revised 23,000 decline the prior week. Consensus expectations had been for a lesser increase to 311,000 claims.
Hurricane related claims totaled 21,000 and brought the total of the three storms during the last twelve weeks to 582,000.
The four-week moving average of initial claims ticked up slightly to 323,250 (-2.5% y/y).
Continuing claims for unemployment insurance rose a sharp 59,000 following three successive weeks of decline.
The insured rate of unemployment held at 2.2% for the ninth consecutive week.
Minutes of the Federal Open Market Committee November 1, 2005 can be found here.
Estimating the "Neutral" Real Interest Rate in Real Time from the Federal Reserve Bank of San Francisco is available here.
| Unemployment Insurance (000s) | 11/19/05 | 11/12/05 | Y/Y | 2004 | 2003 | 2002 |
|---|---|---|---|---|---|---|
| Initial Claims | 335 | 305 | 3.4% | 343 | 402 | 404 |
| Continuing Claims | -- | 2,824 | 3.1% | 2,926 | 3,531 | 3,570 |
by Carol Stone November 23, 2005

Italy's private institute ISAE reported its monthly consumer survey results for November this morning. They show an improving trend in the overall confidence indicator, albeit well below the highs of about four years ago. The indicator is 108.8 this month, 1980=100 and seasonally adjusted, up 3.2 points from October and well above the average of 101.5 for 2004.
Looking at some of the broad components, it's a little hard to see the total index's better than 7% improvement in people's confidence levels over last year's average level. Only the same tiny portion of survey respondents believe the "general situation" is getting better, and the number of those perceiving a worsening trend has declined only minimally. Household financial expectations rated a -7 in November, compared with -8 in 2004. Unemployment expectations seem still to be deteriorating. The share of respondents looking for unemployment to increase over the coming year was 48%, compared with 40% for last year as a whole and only 35% in 2002. This group has taken away from those expecting steady unemployment, which has fallen to 35% this month from 44% for 2004. These movements toward increasing concerns about unemployment extend a pattern that has prevailed since 2001. 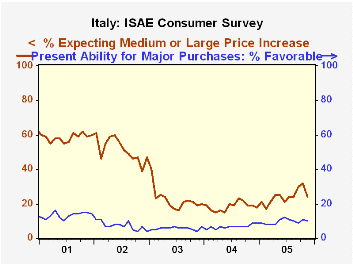
However, there are some positive hints on the inflation front. More consumers look for inflation to pick up than did so last year, but these are many fewer than expected so in 2001 and 2002. This is illustrated in the second graph, where it is also seen that the November figures show marked improvement from October. These price expectations are giving some aid to plans for "major purchases"; the outlook there is still absolutely negative, but it has stabilized in recent months. Referring to durable goods, the survey item "present ability for purchases" has a 10% "favorable" reading in November, up from 7 last year. The "unfavorable" reading is 58% compared with 58% last year. These hardly indicate a consumer spending boom on the horizon, but they do suggest that consumers are less stressed about the buying environment than they have been for some time.
| Italy ISAE Consumer Survey | Nov 2005 | Oct 2005 | Nov 2004 | 2004 | 2003 | 2002 | 2001 |
|---|---|---|---|---|---|---|---|
| Consumer Confidence Indicator (SA, 1980 =100) | 108.8 | 105.6 | 103.8 | 101.5 | 106.2 | 115.8 | 122.6 |
| General Situation Last 12 Mos. | |||||||
| Improving | 4 | 3 | 4 | 3 | 4 | 9 | 15 |
| Worsening | 72 | 77 | 76 | 77 | 73 | 54 | 43 |
| Price Trends Next 12 Mos. | |||||||
| Rapid Increase | 7 | 11 | 6 | 5 | 7 | 16 | 21 |
| Modest Increase | 17 | 21 | 13 | 14 | 15 | 35 | 37 |
| Flat | 47 | 41 | 52 | 54 | 51 | 31 | 25 |
| Unsure | 10 | 8 | 8 | 5 | 5 | 2 | 5 |
| Unemployment Next 12 Mos. | |||||||
| Large Increase | 14 | 17 | 13 | 8 | 8 | 7 | 7 |
| Modest Increase | 34 | 33 | 32 | 32 | 31 | 28 | 23 |
| Unchanged | 35 | 35 | 36 | 44 | 42 | 43 | 39 |

Tom Moeller
AuthorMore in Author Profile »Prior to joining Haver Analytics in 2000, Mr. Moeller worked as the Economist at Chancellor Capital Management from 1985 to 1999. There, he developed comprehensive economic forecasts and interpreted economic data for equity and fixed income portfolio managers. Also at Chancellor, Mr. Moeller worked as an equity analyst and was responsible for researching and rating companies in the economically sensitive automobile and housing industries for investment in Chancellor’s equity portfolio. Prior to joining Chancellor, Mr. Moeller was an Economist at Citibank from 1979 to 1984. He also analyzed pricing behavior in the metals industry for the Council on Wage and Price Stability in Washington, D.C. In 1999, Mr. Moeller received the award for most accurate forecast from the Forecasters' Club of New York. From 1990 to 1992 he was President of the New York Association for Business Economists. Mr. Moeller earned an M.B.A. in Finance from Fordham University, where he graduated in 1987. He holds a Bachelor of Arts in Economics from George Washington University.