 Global| Dec 10 2020
U.S. Credit Demand More "Normal" Share of GDP in Q3
Summary
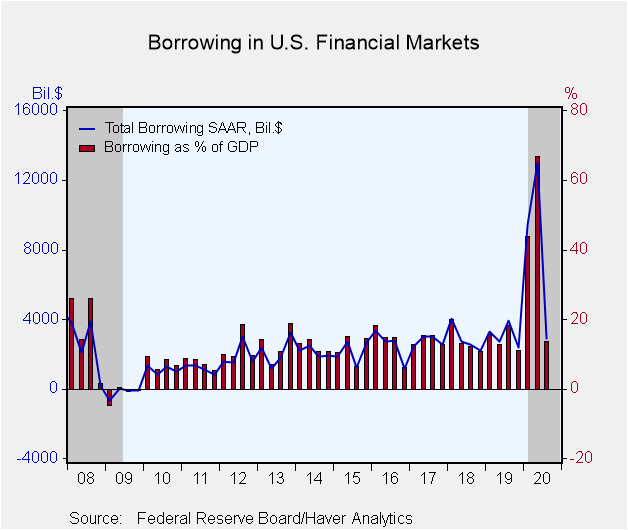
• Total borrowing in U.S. economy = 13.6% of GDP in Q3, down sharply from 66.7% • Government sector borrowing less in Q3 but still quite sizable. • Household borrowing increases with low mortgage rates. After the massive amount of [...]
• Total borrowing in U.S. economy = 13.6% of GDP in Q3, down sharply from 66.7%
• Government sector borrowing less in Q3 but still quite sizable.
• Household borrowing increases with low mortgage rates.
After the massive amount of borrowing during the plunge in economic activity in Q2, there was something of a recovery in Q3 and a return of borrowing to a more typical magnitude. Total borrowing had been $13.017 trillion in Q2, at a seasonally adjusted annual rate, equal to 66.7% of GDP. In Q3, when the economy was growing again, borrowing decreased to $2.888 trillion or 13.6% of GDP. As is evident in the graph here, this is a much more ordinary relationship. Note that all the dollar figures quoted here for the borrowing amounts are seasonally adjusted annual rates.
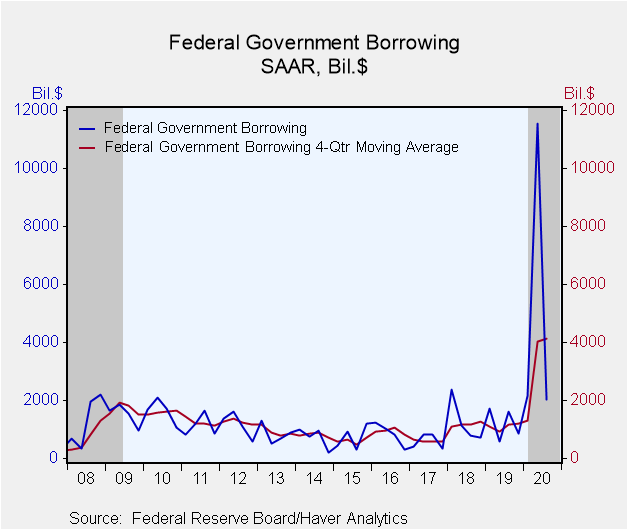
Among sectors of the economy, the biggest swing in dollar amount of borrowing was in the federal government. In Q2, when COVID-related outlays surged, the federal government borrowed at a seasonally adjusted annual rate of $11.5 trillion. Q3's amount was much less dramatic, "just" $2.045 trillion. The Q2 spike in federal credit needs came from surges in social benefits, other transfer payments and subsidies. This last item, for instance, had averaged an annual rate of $68 billion for the eight quarters ending in Q4 2019. But in Q2, it was $1.086 trillion and in Q3, it even rose again to $1.213 trillion. Receipts, by contrast, had fallen from $3.75 trillion in Q1 to $3.47 trillion in Q2, and then recovered to $3.69 trillion in Q3.
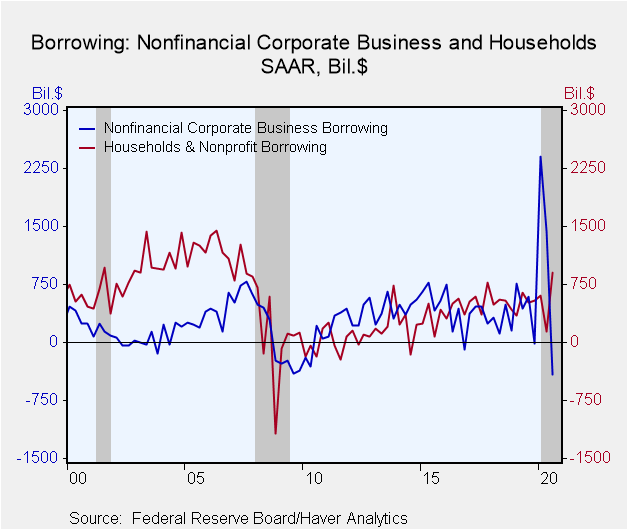
For Q2, we had highlighted the sizable borrowing by the nonfinancial corporate business sector, which had been $1.432 trillion, revised from $1.398 trillion. In Q3, corporate business not only didn't borrow as much, it actually paid down debt, at an annual rate of $404 billion. This debt liquidation occurred in bank loans, which were paid down at an annual rate of $731 billion; this reversed a large share of borrowing corporations had done in Q1, $1.320 trillion. In Q2 they had paid down a modest $5 billion in loans. Companies continued to borrow in the bond market, but at a much slower pace than in Q2, that is, $321 billion, down from Q2's $1.699 trillion.
Households increased their borrowing in Q3. Record low mortgage rates encouraged that use of credit, which amounted to $899 billion, up from just $135 billion in Q2; the Q3 amount is large by recent comparison, but was much larger back in 2006, ahead of the Great Recession. Consumers' use of consumer credit has been modest. People had paid down $234 billion in Q2, and while they borrowed $79 billion in Q3 and $41 billion in Q1, those were small amounts relative to the prior eight or nine years.
As we pointed out for Q2, financial institutions had borrowed heavily for their category in Q1, $4.0 trillion, but paid down $1.4 trillion in Q2. They continued to pay down in Q3, $212 billion.
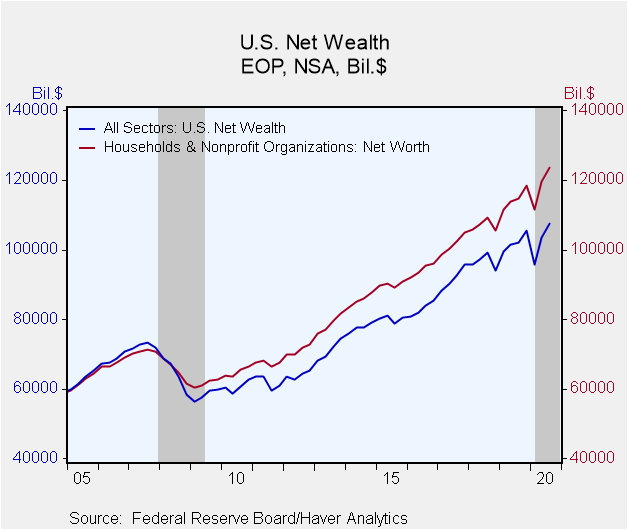
Net wealth in the total U.S. economy increased $4.062 trillion (quarterly rate, not annualized or seasonally adjusted) in Q3, following an increase of $7.837 trillion in Q2 and a drop of $9883 trillion in Q1. This is almost totally explained by the change in market value of corporate equities, which rose $3.909 trillion in Q3 and $8.134 trillion in Q2, with a drop of $9.611 trillion in Q1. These moves are reflected largely in the household sector net worth, which rose $3.817 trillion in Q3, following $8.294 trillion in Q2 and a decrease of $6.886 trillion in Q1.
The Financial Accounts data are in Haver's FFUNDS database. Associated information is compiled in the Integrated Macroeconomic Accounts produced jointly with the Bureau of Economic Analysis (BEA); these are carried in Haver's USNA database as well as in FFUNDS.
| Financial Accounts (SAAR, Bil.$) | Q3'20 | Q2'20 | Q1'20 | Q4'19 | 2019 | 2018 | 2017 |
|---|---|---|---|---|---|---|---|
| Total Borrowing* | 2,888 | 13,017 | 9,454 | 2,384 | 3,079 | 2,870 | 2,743 |
| % of GDP | 13.6 | 66.7 | 43.8 | 11.0 | 14.4 | 13.9 | 14.0 |
| Federal Government | 2,045 | 11,535 | 2,168 | 846 | 1,191 | 1,258 | 599 |
| Households | 899 | 135 | 602 | 544 | 512 | 505 | 563 |
| Nonfinancial Corporate Business | -409 | 1,432 | 2,404 | -13 | 448 | 271 | 387 |
| Financial Sectors | -212 | -1,389 | 4,019 | 175 | 374 | 346 | 330 |
| Foreign Sector | 143 | 215 | -385 | 427 | 252 | 197 | 400 |
*Previously called "credit market borrowing" and includes debt securities plus loans. The total here includes borrowing by noncorporate business and state & local governments, not shown separately.
Carol Stone, CBE
AuthorMore in Author Profile »Carol Stone, CBE came to Haver Analytics in 2003 following more than 35 years as a financial market economist at major Wall Street financial institutions, most especially Merrill Lynch and Nomura Securities. She had broad experience in analysis and forecasting of flow-of-funds accounts, the federal budget and Federal Reserve operations. At Nomura Securities, among other duties, she developed various indicator forecasting tools and edited a daily global publication produced in London and New York for readers in Tokyo. At Haver Analytics, Carol was a member of the Research Department, aiding database managers with research and documentation efforts, as well as posting commentary on select economic reports. In addition, she conducted Ways-of-the-World, a blog on economic issues for an Episcopal-Church-affiliated website, The Geranium Farm. During her career, Carol served as an officer of the Money Marketeers and the Downtown Economists Club. She had a PhD from NYU's Stern School of Business. She lived in Brooklyn, New York, and had a weekend home on Long Island.
More Economy in Brief
 Global| Feb 05 2026
Charts of the Week: Balanced Policy, Resilient Data and AI Narratives
by:Andrew Cates


