 Global| Sep 18 2008
U.S. Credit Market Borrowing Declines Sharply In Q2
Summary
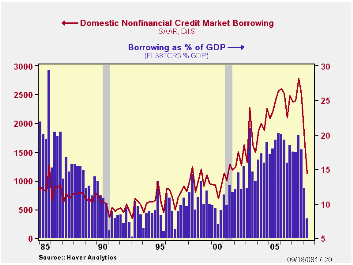
The flows in credit markets in Q2 make us wonder how the US economy grew at all then. Never in the history of the Federal Reserve's Flow-of-Funds data has there been such a sudden dramatic plunge in credit demand. Domestic [...]

The flows in credit markets in Q2 make us wonder how the US economy grew at all then. Never in the history of the Federal Reserve's Flow-of-Funds data has there been such a sudden dramatic plunge in credit demand. Domestic nonfinancial credit market borrowing amounted to $1.127 trillion, SAAR, compared with $1.726 trillion in Q1 and $2.397 trillion in Q2/2007. This quarter was the smallest since Q2/2001 and compares with a peak of $2.780 trillion in Q3/2007. On June 30, credit market debt outstanding stood 6.7% higher than a year ago, a slowdown from 8.6% growth from the beginning to the end of 2007. Relative to the size of the economy, this measure of credit market borrowing sank to just 7.9% of GDP, down from 12.2% in Q1 and about 18.5% over the previous three years.
By sector, household borrowing fell to $197 billion, the smallest amount since Q1/1993. Business borrowing, corporate and noncorporate together, decreased to $582 billion, less than half the 2007 total of $1.203 billion; however, business credit usage is more variable generally, and ran to just $449 billion in 2004, when the economy was quite vigorous. State and local governments raised only $11.0 billion in Q2, much weaker than the average of $139 billion over the last five years. Federal government borrowing eased, but at $310 billion during the quarter, it was still near the high end of its recent range.
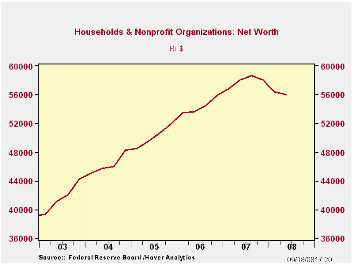
Returning to the household sector, despite the smaller amount of people's borrowing in Q2, their net worth still fell. It was $56.0 trillion, down from $56.4 trillion in Q1, $58.1 trillion in Q4/2007 and the peak of $58.6 trillion in Q3. This is the first decline ever (there are 56 years of history) in household net worth over a span of three quarters. It is all the more remarkable because households' total liabilities actually went down a little, edging to $14.495 from $14.507 trillion. Assets, as seen in the table below, didn't change much, but with a fall of $500 billion, they went down by more than liabilities did, eroding the net.
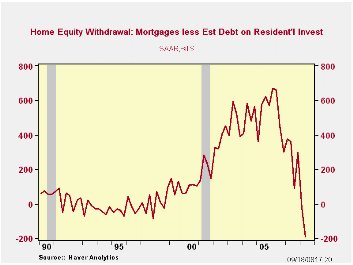
One other note about households: two or three years ago, much was made of "mortgage equity withdrawal", the practice of refinancing one's mortgage and taking out cash to use for other purposes, such as college tuition. This has not only ended, it has now gone the other way. In the Haver-defined series, "MEW" was -$192.1 billion in Q2, meaning that people borrowed less than the amount implied by the volume of residential construction and renovation during the quarter. They were thus contributing to the equity in their property rather than drawing it down, as had been the case over the last 10 years.
The Flow of Funds data are all in Haver's dedicated database FFUNDS. The mortgage equity withdrawal series, those calculated by us and others compiled by researchers at the Fed, are included in the Housing & Construction menus of USECON.
| Flow of Funds (Y/Y % Chg.) | % of Total | 2Q '08 | 1Q '08 | 2007 | 2006 | 2005 |
|---|---|---|---|---|---|---|
| Total Credit Market Debt Outstanding | -- | 6.7 | 7.9 | 8.6 | 9.1 | 9.5 |
| Federal Government | 10% | 7.0 | 5.7 | 4.9 | 3.9 | 7.0 |
| Households | 27% | 4.3 | 5.8 | 6.8 | 10.2 | 11.1 |
| Nonfinancial Corporate Business | 14% | 9.4 | 11.7 | 13.2 | 9.4 | 6.1 |
| Nonfarm, Noncorporate Business | 7% | 11.4 | 13.2 | 13.3 | 12.6 | 13.6 |
| Financial Sectors | 32% | 10.1 | 10.9 | 12.5 | 10.1 | 8.8 |
| Net Worth: Households & Nonprofit Organizations (Trillions) | -- | $55.993 | $56.431 | $58.081 | $55.943 | $51.946 |
| Tangible Assets: Households | -- | $26.149 | $26.331 | $26.574 | $25.930 | $24.369 |
| Financial Assets: Households | -- | $44.340 | $44.606 | $45.905 | $43.486 | $39.777 |
| "Mortgage Equity Withdrawal" (Billions) | -- | -$192.0 | -$27.1 | $282.0 | $520.6 | $531.4 |
Carol Stone, CBE
AuthorMore in Author Profile »Carol Stone, CBE came to Haver Analytics in 2003 following more than 35 years as a financial market economist at major Wall Street financial institutions, most especially Merrill Lynch and Nomura Securities. She had broad experience in analysis and forecasting of flow-of-funds accounts, the federal budget and Federal Reserve operations. At Nomura Securities, among other duties, she developed various indicator forecasting tools and edited a daily global publication produced in London and New York for readers in Tokyo. At Haver Analytics, Carol was a member of the Research Department, aiding database managers with research and documentation efforts, as well as posting commentary on select economic reports. In addition, she conducted Ways-of-the-World, a blog on economic issues for an Episcopal-Church-affiliated website, The Geranium Farm. During her career, Carol served as an officer of the Money Marketeers and the Downtown Economists Club. She had a PhD from NYU's Stern School of Business. She lived in Brooklyn, New York, and had a weekend home on Long Island.
More Economy in Brief
 Global| Feb 05 2026
Charts of the Week: Balanced Policy, Resilient Data and AI Narratives
by:Andrew Cates


