 Global| Jun 18 2015
U.S. Current Account Deficit Widens Again
Summary
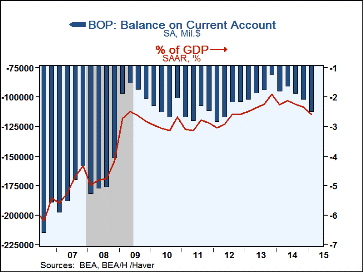
The current account deficit was $113.3 billion in Q1, following $103.1 billion in Q4 2014 and compares to $96.4 billion in Q1 a year ago. All these data are affected by annual revisions, and all are seasonally adjusted. The widening [...]
The current account deficit was $113.3 billion in Q1, following $103.1 billion in Q4 2014 and compares to $96.4 billion in Q1 a year ago. All these data are affected by annual revisions, and all are seasonally adjusted. The widening in the latest period came from a bigger deficit in goods trade and a smaller surplus on primary income. In contrast, the balance on services improved a bit and the deficit in secondary income narrowed slightly. The current account result was more favorable than the Action Economics Forecast Survey, which had expected a deficit of $117.5 billion.
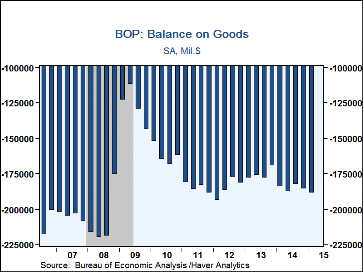
The deficit on goods was $189.0 billion in Q1 after $186.0 billion in Q4. Both exports and imports dropped markedly, exports by 6.5% (-4.7% y/y) and imports by 3.9% (-2.4% y/y). Most types of exports participated in the decline, and most indeed showed sizable drops. Some can be attributed to the fall in petroleum prices, but a number of other goods exports also decreased noticeably. Among imports, the drop was more than accounted for by petroleum, which fell $25.4 billion from Q4, as the total went down $23.4 billion.
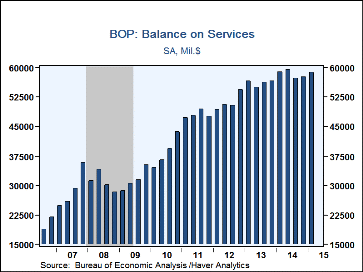
The trade surplus on services increased to $58.7 billion in Q1 from a slightly revised $57.6 billion in Q4. Exports of services gained 1.0% (3.3% y/y), while imports of services edged up 0.5% (5.1% y/y). Among services exports, spending on "other business services" increased notably, and travel increased somewhat. Other categories were little changed. On the import side, the largest increase was in transport, with only modest moves among other types of services.
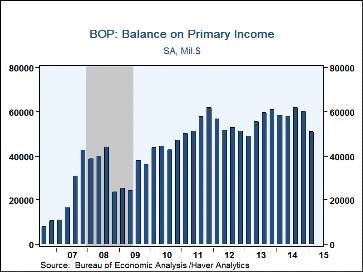
The surplus on primary income fell sharply to $50.6 billion in Q1 from an upwardly revised $60.0 billion in Q4. Direct investment income plunged to $109.5 billion from $118.6 billion; portfolio income was down moderately. The overall primary income surplus was also held down by an increase in portfolio income payments to foreign investors, although a decrease in direct investment income payments was partially offsetting. The deficit on secondary income, that is, transfer payments, narrowed a bit to $33.8 billion in Q1 from 34.8 billion in Q4, as payments rose slightly more than receipts.
From the financial account, private direct investment abroad was $75. 6 billion in Q1 after its surge to $112.5 billion in Q4. Portfolio investment surged this time, to $230.2 billion after slowing to $81.1 billion in Q4. Foreign direct investment into the U.S. was very large, at $186.2 billion, compared to just $50.5 billion in Q4 and a net reduction of $105.4 billion a year ago. Portfolio investments in the U.S. diminished to $100.8 billion from $133.0 billion in Q4.
Balance of Payments data are in Haver's USINT database, with summaries available in USECON. The expectations figure is in the AS1REPNA database.
| US Balance of Payments SA* | Q1'15 | Q4'14 | Q3'14 | Y/Y** | 2014 | 2013 | 2012 |
|---|---|---|---|---|---|---|---|
| Current Account Balance ($ Billion) | -113.3 | -103.1 | -97.9 | -96.4 | -389.5 | -376.8 | -449.7 |
| Deficit % of GDP | -2.6 | -2.3 | -2.2 | -2.3% | -2.2% | -2.2% | -2.8% |
| Balance on Goods ($ Billion) | -189.0 | -186.0 | -183.1 | -184.3 | -741.5 | -702.6 | -741.1 |
| Exports | -6.5% | -0.9% | 0.9% | -4.7% | 2.5% | 1.9% | 4.2% |
| Imports | -3.9% | -0.2% | -0.2% | -2.4% | 3.5% | -0.4% | 2.9% |
| Balance on Services ($ Billion) | 58.7 | 57.6 | 57.2 | 58.9 | 233.1 | 224.2 | 204.4 |
| Exports | 1.0% | 2.0% | -1.3% | 3.3% | 3.3% | 4.8% | 4.6% |
| Imports | 0.5% | 2.6% | -0.2% | 5.1% | 3.0% | 2.6% | 3.7% |
| Balance on Primary Income ($ Billion) | 50.8 | 60.0 | 61.7 | 58.2 | 238.0 | 224.5 | 212.2 |
| Balance on Secondary Income ($ Billion) | -33.8 | -34.8 | -33.8 | -29.3 | -119.2 | -122.9 | -125.1 |
Carol Stone, CBE
AuthorMore in Author Profile »Carol Stone, CBE came to Haver Analytics in 2003 following more than 35 years as a financial market economist at major Wall Street financial institutions, most especially Merrill Lynch and Nomura Securities. She had broad experience in analysis and forecasting of flow-of-funds accounts, the federal budget and Federal Reserve operations. At Nomura Securities, among other duties, she developed various indicator forecasting tools and edited a daily global publication produced in London and New York for readers in Tokyo. At Haver Analytics, Carol was a member of the Research Department, aiding database managers with research and documentation efforts, as well as posting commentary on select economic reports. In addition, she conducted Ways-of-the-World, a blog on economic issues for an Episcopal-Church-affiliated website, The Geranium Farm. During her career, Carol served as an officer of the Money Marketeers and the Downtown Economists Club. She had a PhD from NYU's Stern School of Business. She lived in Brooklyn, New York, and had a weekend home on Long Island.
More Economy in Brief
 Global| Feb 05 2026
Charts of the Week: Balanced Policy, Resilient Data and AI Narratives
by:Andrew Cates


