 Global| Sep 16 2010
U.S. Current Account Deficit Widens Further in Q2 with Less Growth in Goods Exports & Steady Growth in Imports
Summary
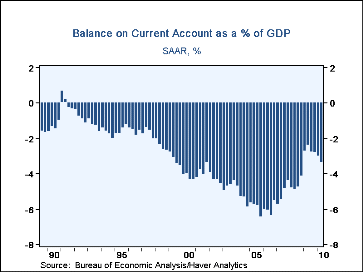
The U.S. current account deficit widened in Q2 to $123.3 billion from a revised $109.2 billion in Q1; this result was very close to consensus expectations for $123.9 billion. The Q2 ratio to GDP is 3.4%, up from 3.0% in Q1. The [...]
The U.S. current account deficit widened in Q2 to $123.3 billion from a revised $109.2 billion in Q1; this result was very close to consensus expectations for $123.9 billion. The Q2 ratio to GDP is 3.4%, up from 3.0% in Q1. The balance on goods accounted for the widening, with balances on services, income and unilateral transfers all narrowing somewhat from the prior quarter.
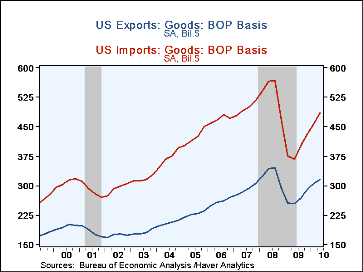
The deficit on goods was $169.6 billion in Q2, larger than the $151.3 billion in Q1. Goods exports increased 3.4%, compared with 5.2% in Q1 and 8.1% in Q4 2009. While Q2 had the slowest growth of the last four quarters, it is important to put this in historical perspective which shows that the five-year average of quarterly growth has rarely exceeded 3%. So this latest quarter continues a cyclical rebound marked by relative vigor. The year-on-year growth totals 24.4%.
Imports of goods grew 6.3% in the quarter and were up 32.2% from a year ago. This too remains stronger than the historical experience. It is often thought that U.S. demand for goods from abroad is insatiable, but in fact the five-year average of quarterly growth did not exceed 3% during the last expansionary cycle phase. So recent gains in excess of that evidently represent some catch-up after the extreme drops during the recent recession.
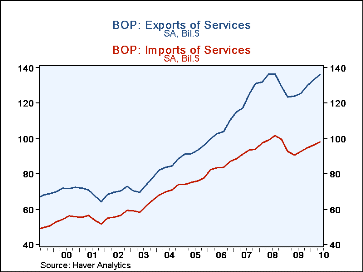
The surplus on services rose to $38.0 billion in Q2 from $36.9 billion in Q1; the year-ago figure was $33.1 billion. Recent quarters have seen growth in both exports and imports of services. Most notably, we notice a strong rise in "other transportation" on the import side. This largely covers freight charges on foreign-owned shipping lines and follows from the resumption of growth in trade, so it would seem a healthy development.
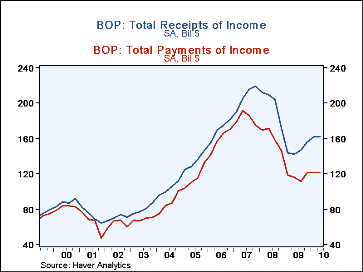
The balance on income rose modestly to $41.2 billion in Q2 from $40.2 billion the quarter before. Income receipts totaled $161.1 billion, up just $615 million from Q1. Income from private investments, that is, interest and dividends, gained $1.6 billion, its strongest quarterly performance since the middle of 2007. But direct investment income fell back a bit after sizable increases the prior four quarters. Income payments fell slightly in Q2 to $120.7 billion from $121.1 billion in Q1; increases in payments to foreign investors of interest and dividends were offset by a drop in direct investment payments.
Finally, unilateral transfers showed a net outflow of $32.9 billion in Q2, less than the $34.9 billion in Q1. Government grants fell $2.2 billion, with government pensions and private remittances basically unchanged.
Commentary on accompanying financial flow data will follow with coverage of the Federal Reserve Flow-of-Funds, due to be published September 17.
Balance of Payments data all appear in Haver's USINT database, with summaries available in USECON.
| US Balance of Payments SA | 2Q '10 | 1Q '10 | 4Q '09 | Year Ago | 2009 | 2008 | 2007 |
|---|---|---|---|---|---|---|---|
| Current Account Balance($ Bil.) | -123.3 | -109.2 | -100.9 | -84.4 | -378.4 | -668.9 | -718.1 |
| Deficit % of GDP | 3.4% | 3.0% | 2.8% | 2.4% | 2.7% | 4.6% | 5.1% |
| Balance on Goods ($ Bil.) | -169.6 | -151.3 | -140.1 | -113.5 | -506.9 | -834.7 | -823.2 |
| Exports | 3.4% | 5.2% | 8.1% | 24.4% | -18.1% | 12.5% | 12.0% |
| Imports | 6.3% | 6.1% | 7.4% | 32.2% | -26.4% | 7.9% | 5.8% |
| Balance on Services ($ Bil.) | 38.0 | 36.9 | 35.4 | 33.1 | 132.0 | 135.8 | 121.1 |
| Exports | 1.9% | 2.6% | 3.7% | 9.7% | -6.0% | 9.4% | 17.1% |
| Imports | 1.5% | 2.1% | 2.1% | 7.8% | -7.0% | 8.5% | 9.1% |
| Balance on Income ($ Bil.) | 41.2 | 40.2 | 35.1 | 26.3 | 121.4 | 152.0 | 99.6 |
| Unilateral Transfers ($ Bil.) | -35.5 | -34.9 | -31.6 | -30.3 | -124.9 | -122.0 | -115.6 |
Carol Stone, CBE
AuthorMore in Author Profile »Carol Stone, CBE came to Haver Analytics in 2003 following more than 35 years as a financial market economist at major Wall Street financial institutions, most especially Merrill Lynch and Nomura Securities. She had broad experience in analysis and forecasting of flow-of-funds accounts, the federal budget and Federal Reserve operations. At Nomura Securities, among other duties, she developed various indicator forecasting tools and edited a daily global publication produced in London and New York for readers in Tokyo. At Haver Analytics, Carol was a member of the Research Department, aiding database managers with research and documentation efforts, as well as posting commentary on select economic reports. In addition, she conducted Ways-of-the-World, a blog on economic issues for an Episcopal-Church-affiliated website, The Geranium Farm. During her career, Carol served as an officer of the Money Marketeers and the Downtown Economists Club. She had a PhD from NYU's Stern School of Business. She lived in Brooklyn, New York, and had a weekend home on Long Island.
More Economy in Brief
 Global| Feb 05 2026
Charts of the Week: Balanced Policy, Resilient Data and AI Narratives
by:Andrew Cates


