 Global| May 24 2012
U.S. Durable Goods Orders Appear in Holding Pattern
Summary
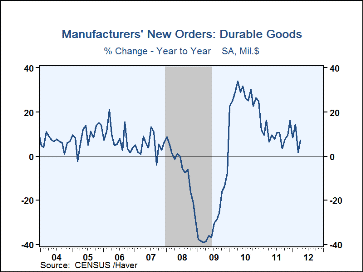
New orders for durable goods edged up 0.2% in April after a revised decrease of 3.7% in March (originally reported at 4.2%).
 New orders for durable goods edged up 0.2% in April after a revised decrease
of 3.7% in March (originally reported at 4.2%). They are 6.9% ahead
of a year ago. The Action Economics consensus forecast had looked for a 1%
increase. The nearly flat April performance
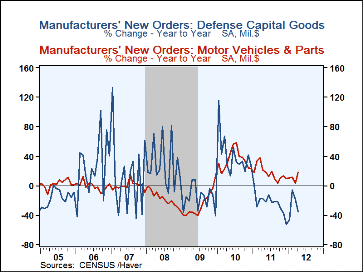
encompassed a sizable drop in defense-related orders, 19.6%, basically offset by
a gain in nondefense sectors, especially motor vehicles.
The pattern among industries was mixed. As noted, defense-related orders fell; those for aircraft dropped 34.0%, carrying these orders to their lowest level since last September. Other defense goods orders were off 2.5% following a 16.7% decrease in March. In contrast, nondefense aircraft rose 21.8%, recovering some of its 61.8% plunge in March, although nondefense capital goods orders excluding aircraft declined 1.9%, marking their fourth decrease in the last six months. The motor vehicle sector did show a nice rise, 5.6%, in April, its fifth consecutive and largest recent increase.
Among other sectors, orders in the computer and electronics sector edged down 0.6%, although these declines hit computers and communications equipment most directly; other electronics goods saw orders rise 3.7%, more than offsetting their 1.6% decrease in March. Orders for metals increased 1.7%, but orders for fabricated metal products fell 2.0%. Nonelectrical machinery saw a 2.8% decline, while electrical equipment was basically flat, with just a 0.1% fall. Orders for "other" durable goods increased 0.5%.
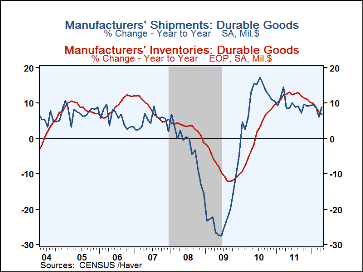
Total shipments of durable goods rose 0.7% in April and inventories increased 0.3%; unfilled orders backtracked marginally by 0.1%, and stand largely unchanged since the end of February. This report was aligned with the annual benchmark and seasonal adjustment revisions which the Census Bureau released last Friday. Generally, it looks that the revisions had little substantive impact, but they do seem to show steeper declines during the worst of the recession in 2009, followed by somewhat stronger rebounds on average for 2010.
The durable goods figures are available in Haver's USECON database. The Action Economics consensus forecast figure is in the AS1REPNA database.
| Durable Goods NAICS Classification (%) | April | Mar | Feb | Jan | Y/Y | 2011 | 2010 | 2009 |
|---|---|---|---|---|---|---|---|---|
| New Orders | 0.2 | -3.7 | 2.0 | -3.5 | 6.9 | 9.8 | 27.1 | -30.0 |
| Nondefense Capital Goods | -0.2 | -12.1 | 1.9 | -6.9 | 5.1 | 13.2 | 36.3 | -36.9 |
| Excluding Aircraft | -1.9 | -2.2 | 2.9 | -3.1 | 2.6 | 10.3 | 17.1 | -24.5 |
| Shipments | 0.7 | 1.0 | -0.5 | 0.1 | 8.9 | 9.6 | 11.4 | -21.0 |
| Inventories | 0.3 | 0.4 | 0.3 | 0.6 | 6.8 | 10.3 | 9.5 | -10.2 |
| Unfilled Orders | -0.1 | 0.0 | 1.1 | 0.6 | 9.3 | 10.3 | 9.6 | -19.5 |
Carol Stone, CBE
AuthorMore in Author Profile »Carol Stone, CBE came to Haver Analytics in 2003 following more than 35 years as a financial market economist at major Wall Street financial institutions, most especially Merrill Lynch and Nomura Securities. She had broad experience in analysis and forecasting of flow-of-funds accounts, the federal budget and Federal Reserve operations. At Nomura Securities, among other duties, she developed various indicator forecasting tools and edited a daily global publication produced in London and New York for readers in Tokyo. At Haver Analytics, Carol was a member of the Research Department, aiding database managers with research and documentation efforts, as well as posting commentary on select economic reports. In addition, she conducted Ways-of-the-World, a blog on economic issues for an Episcopal-Church-affiliated website, The Geranium Farm. During her career, Carol served as an officer of the Money Marketeers and the Downtown Economists Club. She had a PhD from NYU's Stern School of Business. She lived in Brooklyn, New York, and had a weekend home on Long Island.
More Economy in Brief
 Global| Feb 05 2026
Charts of the Week: Balanced Policy, Resilient Data and AI Narratives
by:Andrew Cates


