 Global| Sep 26 2007
U.S. Durable Goods Orders Drop by 4.9% in August after 6.1% Spurt in July
Summary
Durables goods orders fell sharply in August by 4.9% after a 6.1% spurt in July. Excluding transportation, orders fell by 1.8% after a +3.4% in July and a 1.3% drop in June. Orders growth has been erratic. Still, trends are for the [...]
Durables goods orders fell sharply in August by 4.9% after a 6.1% spurt in July. Excluding transportation, orders fell by 1.8% after a +3.4% in July and a 1.3% drop in June. Orders growth has been erratic.
Still, trends are for the most part HEALTHY IF NOT STRONG as the main industry groups show shipments growth is still outpacing the growth of inventories. Over three months, only machinery and primary metal shipments lag behind the growth in inventories. Over six months, all seven main groups show shipments growth ahead of inventory growth. Over twelve months, the score is mixed with three above and four below. No major industry group is showing persistent inventory growth problems relative to sales growth. Only machinery shows any tendency for inventory growth to accelerate. Inventories are not an issue here. Unfortunately, shipments growth is also showing signs of slowing from the 6-month growth pace to the recent 3-month pace for most categories. The transportation and electrical equipment sectors are accelerating their shipments on this horizon.
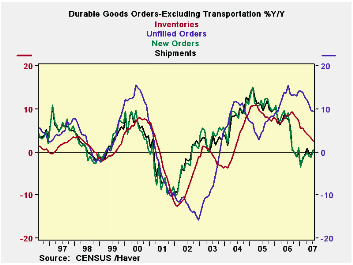
On balance, orders and shipments are slowing year/year and are flat excluding transportation (see accompanying chart).
The sequential growth rates in the table below show that the near-term growth picture is a bit brighter than the year/year picture. Though excluding transportation, 3-month orders and shipments are weak.
Unfilled orders continue to be a bright spot where there is slowing in manufacturing.
The nondefense capital goods sector is slowing and the slowdown is more extreme excluding aircraft with negative orders and shipments on that definition.
On balance, the durable goods report is weak on the month. But trends show a picture that is mostly flat and without much near term pick up when transportation is removed. Capital spending seems to have slowed (excluding aircraft). The two bright spots in the report are (1) the low continuing growth in inventories and the moderate I/S ratios that exist, (2) the continuing strong growth in order back logs (unfilled orders) that suggest that firms are still accumulating business even if they are slowing orders and shipments.
| Durable Goods Orders | |||||
|---|---|---|---|---|---|
| Durable Goods | 3Mo | 6Mo | 9Mo | 12Mo | Year Ago |
| Shipments | 5.1% | 10.1% | 4.6% | 0.7% | 6.5% |
| New Orders | 11.1% | 13.4% | 2.8% | 4.0% | 3.4% |
| Unfilled Orders | 22.8% | 21.4% | 18.4% | 21.9% | 17.6% |
| Inventories | -0.1% | 0.9% | 1.8% | 3.7% | 7.8% |
| I:S Ratio | 1.46 | 1.51 | 1.47 | 1.40 | 1.38 |
| Excluding Transportation | 3Mo | 6Mo | 9Mo | 12Mo | Year Ago |
| Shipments | -0.6% | 7.9% | 3.6% | 0.0% | 8.5% |
| New Orders | 1.2% | 8.2% | 3.7% | 1.4% | 5.0% |
| Unfilled Orders | 9.2% | 8.3% | 9.0% | 10.1% | 13.3% |
| Inventories | -0.5% | -0.7% | 0.7% | 2.5% | 8.6% |
| I:S Ratio | 1.50 | 1.56 | 1.53 | 1.46 | 1.46 |
| Excluding Defense | 3Mo | 6Mo | 9Mo | 12Mo | Year Ago |
| Shipments | 5.0% | 10.3% | 4.7% | 0.6% | 6.4% |
| New Orders | 3.2% | 8.9% | 2.3% | 3.4% | 1.8% |
| Unfilled Orders | 25.9% | 26.9% | 23.8% | 26.3% | 23.0% |
| Inventories | 0.0% | 0.8% | 2.2% | 4.1% | 8.4% |
| I:S Ratio | 1.43 | 1.48 | 1.44 | 1.36 | 1.34 |
| NonDefense Capital Goods | 3Mo | 6Mo | 9Mo | 12Mo | Year Ago |
| Shipments | 5.0% | 9.7% | 1.8% | 0.2% | 10.0% |
| New Orders | -9.8% | 6.1% | -2.9% | 4.6% | 2.2% |
| Unfilled Orders | 34.4% | 37.7% | 32.2% | 35.6% | 25.7% |
| Inventories | 3.4% | 5.2% | 6.3% | 7.7% | 6.4% |
| I:S Ratio | 1.84 | 1.87 | 1.77 | 1.70 | 1.76 |

Robert Brusca
AuthorMore in Author Profile »Robert A. Brusca is Chief Economist of Fact and Opinion Economics, a consulting firm he founded in Manhattan. He has been an economist on Wall Street for over 25 years. He has visited central banking and large institutional clients in over 30 countries in his career as an economist. Mr. Brusca was a Divisional Research Chief at the Federal Reserve Bank of NY (Chief of the International Financial markets Division), a Fed Watcher at Irving Trust and Chief Economist at Nikko Securities International. He is widely quoted and appears in various media. Mr. Brusca holds an MA and Ph.D. in economics from Michigan State University and a BA in Economics from the University of Michigan. His research pursues his strong interests in non aligned policy economics as well as international economics. FAO Economics’ research targets investors to assist them in making better investment decisions in stocks, bonds and in a variety of international assets. The company does not manage money and has no conflicts in giving economic advice.
More Economy in Brief


