 Global| Dec 23 2010
U.S. Durable Goods Orders Still Mixed Through November
Summary
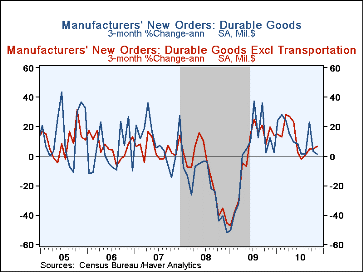
The mixed pattern of durable goods orders continued through November. Total orders fell another 1.3%, following October's 3.1% drop. But apart from transportation, they were up 2.4%, reversing the 1.9% decline in October, which itself [...]
 The mixed pattern of durable goods orders continued through November.
Total orders fell another 1.3%, following October's 3.1% drop. But apart
from transportation, they were up 2.4%, reversing the 1.9% decline in October,
which itself was revised from -2.7%. Consensus forecasts for the total
anticipated no change in November's orders.
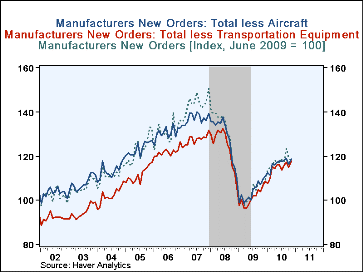
Most individual industries saw gains. Primary metals orders were up 3.0%, the second sizable increase in a row. Fabricated metal products and machinery orders rose 2.0% and 0.5%, respectively. The computer sector saw a nice rise of 5.8%, including gains in both computers and communications equipment. Less favorable results came in motor vehicles, which fell 2.9%, continuing a declining trend; aircraft orders fell for a second month after September's surge. Through all of the recent ups and downs, we see in the second graph here that orders are continuing a modest recovery, with the major "ex transportation" and "ex-aircraft" subsets behaving about in line with the total over time; we can see a distinct slowing, though, in the last several months. This graph shows all three of these aggregates indexed to June 2009, which was the trough of the recession; such indexing at a point in time named by the user is a specific feature of Haver's DLXVG3 software.
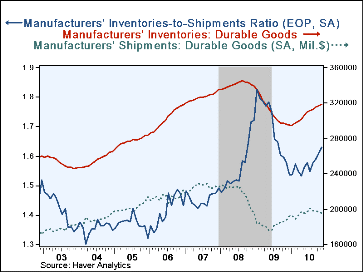
Shipments of durable goods continued their sluggish pattern of recent months, easing 0.3% in November. This decline was concentrated in transportation, however, and excluding that sector, they rose a respectable 0.6%; they are flat, then, on balance over the last six months. Inventories accumulated further in November, increasing 0.6%, the same move as in October and close in line with preceding months. This behavior puts the inventory/shipments ratio at 1.63, the highest since August 2009. It's hard to know whether this upshift is deliberate, reflecting improving manufacturers' expectations, or, with the sluggish pattern of shipments, it may be that inventories in some industries are piling up. ISM survey data might suggest the latter condition.
The durable goods figures are available in Haver's USECON database.
| NAICS Classification (%) | November | October | September | Y/Y | 2009 | 2008 | 2007 |
|---|---|---|---|---|---|---|---|
| Durable Goods Orders | -1.3 | -3.1 | 4.9 | 9.4 | -20.7 | -9.0 | 9.7 |
| Excluding Transportation | 2.4 | -1.9 | 1.1 | 10.6 | -18.4 | -2.5 | 4.5 |
| Nondefense Capital Goods | -6.8 | -4.2 | 11.6 | 18.0 | -26.8 | -12.6 | 17.5 |
| Excluding Aircraft | 2.6 | -3.6 | 1.8 | 14.4 | -19.8 | -4.2 | 5.3 |
Carol Stone, CBE
AuthorMore in Author Profile »Carol Stone, CBE came to Haver Analytics in 2003 following more than 35 years as a financial market economist at major Wall Street financial institutions, most especially Merrill Lynch and Nomura Securities. She has broad experience in analysis and forecasting of flow-of-funds accounts, the federal budget and Federal Reserve operations. At Nomura Securites, among other duties, she developed various indicator forecasting tools and edited a daily global publication produced in London and New York for readers in Tokyo. At Haver Analytics, Carol is a member of the Research Department, aiding database managers with research and documentation efforts, as well as posting commentary on select economic reports. In addition, she conducts Ways-of-the-World, a blog on economic issues for an Episcopal-Church-affiliated website, The Geranium Farm. During her career, Carol served as an officer of the Money Marketeers and the Downtown Economists Club. She has a PhD from NYU's Stern School of Business. She lives in Brooklyn, New York, and has a weekend home on Long Island.


