 Global| Feb 21 2019
U.S. Durable Goods Report: Strong Headline, Weaker Details
Summary
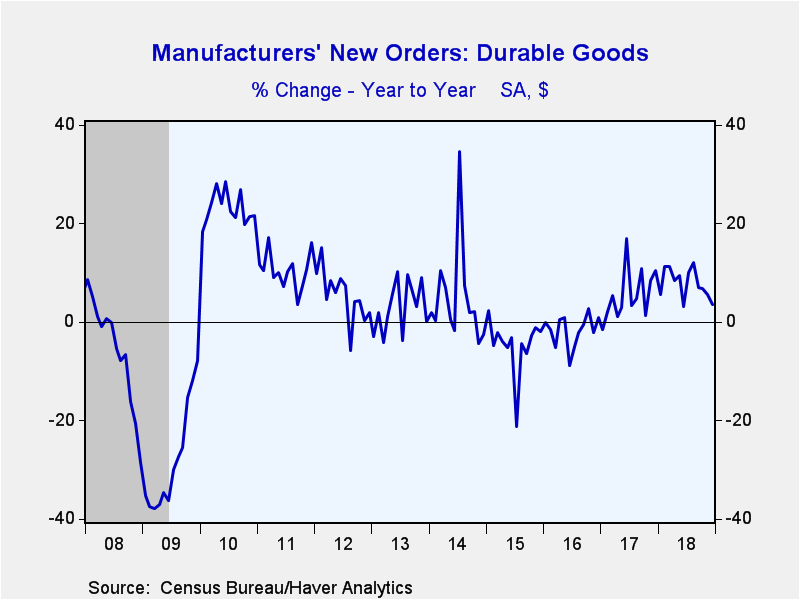
New orders for durable goods increased 1.2% (3.5% year-on-year) during December following an upwardly-revised 1.0% gain in November (this report was delayed as a result of the government shutdown). A 1.7% increase had been expected in [...]
New orders for durable goods increased 1.2% (3.5% year-on-year) during December following an upwardly-revised 1.0% gain in November (this report was delayed as a result of the government shutdown). A 1.7% increase had been expected in the Action Economics Forecast Survey. A 4.8% jump in volatile aircraft orders (-24.8% y/y) as well as a 2.1% increase in motor vehicles (11.6% y/y) drove the gain. Excluding the transportation sector, durable goods bookings edged up 0.1% (3.5% y/y). Nondefense capital goods orders less aircraft fell 0.7% (+2.5% y/y) and were down at a 3.4% annual rate in the fourth quarter. In Q3, core capital goods orders grew at an 8.0% pace. This data suggests weakness ahead in equipment spending.
Machinery orders declined 0.4% in December (+0.2% y/y). Electrical equipment edged down 0.1% (+3.9% y/y) and primary metals decreased 0.9% (+8.2% y/y). Orders for computers were unchanged (7.8% y/y), fabricated metals up 0.3% (6.0% y/y), and other durable goods grew 0.9% (-0.8% y/y).
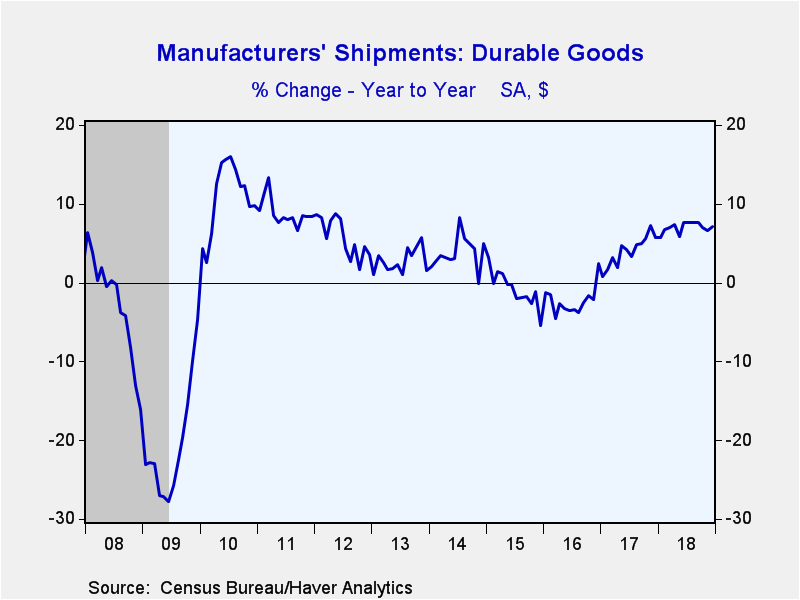
Shipments of durable goods increased 0.8% during December (7.1% y/y) following an upwardly-revised 1.0% gain (was 0.7%). Excluding the transportation sector, shipments gained 0.4% (4.4% y/y). Nondefense capital goods shipments excluding aircraft grew 0.5% (3.7% y/y) and were up at a 2.3% annual rate in Q4. In Q3 core capital goods shipments rose at 6.9% annual rate.
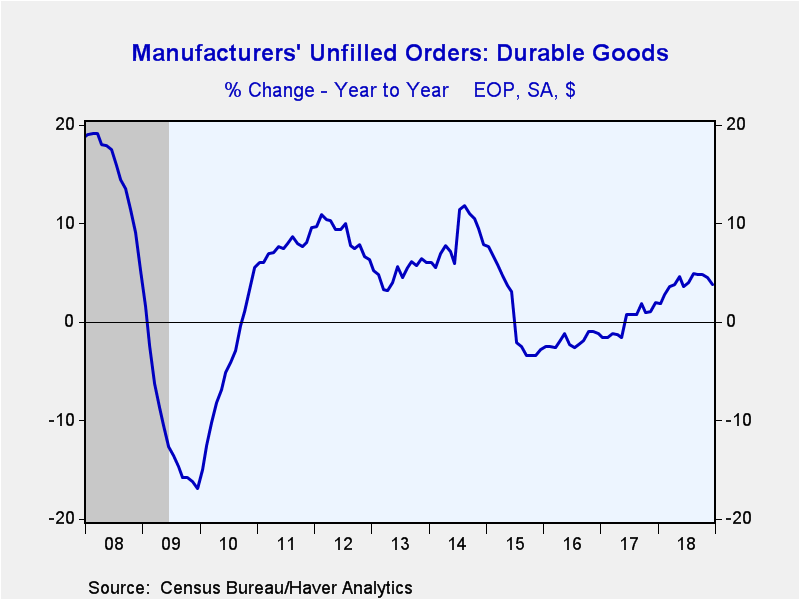
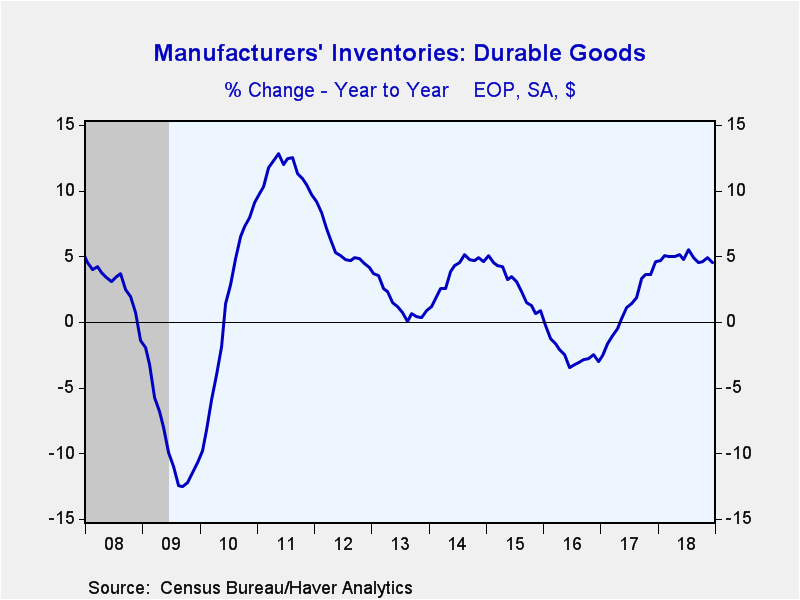
Unfilled orders for durable goods eased 0.1% (+3.8% y/y); excluding transportation, order backlogs were unchanged (4.5% y/y). Inventories of durable goods rose 0.2% (4.5% y/y). Excluding transportation, inventories increased 0.4% (5.4% y/y).
The durable goods figures are available in Haver's USECON database. The Action Economics consensus forecast figure is in the AS1REPNA database.
| Durable Goods NAICS Classification | Dec | Nov | Oct | Dec Y/Y | 2018 | 2017 | 2016 |
|---|---|---|---|---|---|---|---|
| New Orders (SA, % chg) | 1.2 | 1.0 | -4.3 | 3.5 | 7.8 | 5.4 | -1.7 |
| Transportation | 3.3 | 3.4 | -12.4 | 3.5 | 9.7 | 3.4 | -0.7 |
| Total Excluding Transportation | 0.1 | -0.2 | 0.4 | 3.5 | 6.8 | 6.5 | -2.3 |
| Nondefense Capital Goods | 3.7 | 0.3 | -4.7 | 0.3 | 5.6 | 9.1 | -5.8 |
| Excluding Aircraft | -0.7 | -1.0 | 0.5 | 2.5 | 5.9 | 6.7 | -4.5 |
| Shipments | 0.8 | 1.0 | -0.3 | 7.1 | 7.0 | 4.0 | -2.4 |
| Unfilled Orders | -0.1 | -0.2 | -0.2 | 3.8 | 3.8 | 2.0 | -1.2 |
| Inventories | 0.2 | 0.4 | 0.2 | 4.5 | 4.5 | 4.6 | -3.0 |
Gerald D. Cohen
AuthorMore in Author Profile »Gerald Cohen provides strategic vision and leadership of the translational economic research and policy initiatives at the Kenan Institute of Private Enterprise.
He has worked in both the public and private sectors focusing on the intersection between financial markets and economic fundamentals. He was a Senior Economist at Haver Analytics from January 2019 to February 2021. During the Obama Administration Gerald was Deputy Assistant Secretary for Macroeconomic Analysis at the U.S. Department of Treasury where he helped formulate and evaluate the impact of policy proposals on the U.S. economy. Prior to Treasury, he co-managed a global macro fund at Ziff Brothers Investments.
Gerald holds a bachelor’s of science from the Massachusetts Institute of Technology and a Ph.D. in Economics from Harvard University and is a contributing author to 30-Second Money as well as a co-author of Political Cycles and the Macroeconomy.
More Economy in Brief
 Global| Feb 05 2026
Charts of the Week: Balanced Policy, Resilient Data and AI Narratives
by:Andrew Cates


