 Global| Jan 30 2015
U.S. Employment Cost Index Moderates in Q4
Summary
The employment cost index for private industry workers rose 0.6% (2.1% y/y) in Q4'14, following an unrevised 0.7% Q3 rise. The Q3 number equaled expectations for a 0.6% rise in the Action Economics Forecast Survey. For 2014 as a [...]
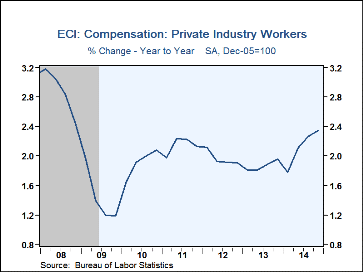
The employment cost index for private industry workers rose 0.6% (2.1% y/y) in Q4'14, following an unrevised 0.7% Q3 rise. The Q3 number equaled expectations for a 0.6% rise in the Action Economics Forecast Survey. For 2014 as a whole, compensation costs were up 2.1% after 1.9% in 2013.
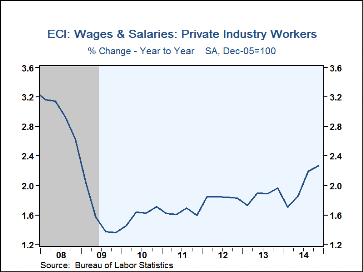
Wages & salaries of private industry workers also increased 0.6% (2.0% y/y) last quarter after their 0.7% Q3 rise. Most sectors hovered near the overall total: health care was the strongest at 0.8% (1.9% y/y), while construction (1.9% y/y), manufacturing (2.3% y/y), retail trade (2.4% y/y) and finance (1.8% y/y) all had 0.7% rises in the quarter. Information (2.0% y/y) and education (1.7% y/y) were both up 0.6%, with professional and business services up 0.5% (2.5% y/y), utilities 0.4% (2.5% y/y) and transportation 0.3% (2.5% y/y). Overall for 2014, wages and salaries gained 2.0%, the largest gain since 2008.
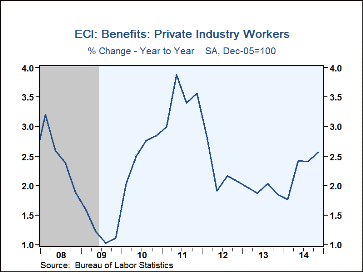
Benefit costs were up 0.6% (2.6% y/y) after a similar 0.6% Q3 rise. Reported by occupational group, natural resource, construction and maintenance workers had the largest benefit increase, 0.8% (3.5% y/y) with management & professional workers (2.7% y/y), sales and office staff (2.5% y/y) and service occupations (1.0% y/y) all up 0.6% in the quarter. Production and transportation worker benefits rose 0.5% (2.2% y/y). Private industry workers' benefits were up 2.3% for all of 2014, stronger than 1.9% in 2013.
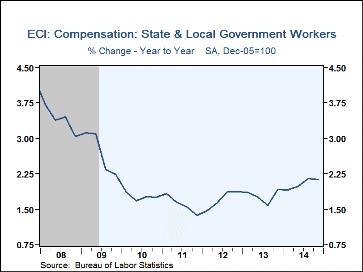
Total compensation for state & local government workers rose 0.6% (2.1% y/y) in Q4 after three quarters with 0.5% each. In Q4, education workers' compensation gained 0.7% (2.0% y/y), health care and social assistance 0.6% (1.5% y/y) and public administration workers, also 0.6% (2.4% y/y). All state and local government worker compensation was up 2.0% for 2014 as a whole, not historically strong, but the firmest since 2009.
The employment cost index figures are available in Haver's USECON database. Consensus estimates come from the Action Economics survey, carried in Haver's AS1REPNA database.
| ECI- Private Industry Workers (%) | Q4'14 | Q3'14 | Q2'14 | Q4 Y/Y | 2014 | 2013 | 2012 |
|---|---|---|---|---|---|---|---|
| Compensation | 0.6 | 0.7 | 0.8 | 2.3 | 2.1 | 1.9 | 2.0 |
| Wages & Salaries | 0.6 | 0.7 | 0.8 | 2.3 | 2.0 | 1.9 | 1.8 |
| Benefit Costs | 0.6 | 0.6 | 1.1 | 2.6 | 2.3 | 1.9 | 2.2 |
Carol Stone, CBE
AuthorMore in Author Profile »Carol Stone, CBE came to Haver Analytics in 2003 following more than 35 years as a financial market economist at major Wall Street financial institutions, most especially Merrill Lynch and Nomura Securities. She had broad experience in analysis and forecasting of flow-of-funds accounts, the federal budget and Federal Reserve operations. At Nomura Securities, among other duties, she developed various indicator forecasting tools and edited a daily global publication produced in London and New York for readers in Tokyo. At Haver Analytics, Carol was a member of the Research Department, aiding database managers with research and documentation efforts, as well as posting commentary on select economic reports. In addition, she conducted Ways-of-the-World, a blog on economic issues for an Episcopal-Church-affiliated website, The Geranium Farm. During her career, Carol served as an officer of the Money Marketeers and the Downtown Economists Club. She had a PhD from NYU's Stern School of Business. She lived in Brooklyn, New York, and had a weekend home on Long Island.
More Economy in Brief
 Global| Feb 05 2026
Charts of the Week: Balanced Policy, Resilient Data and AI Narratives
by:Andrew Cates


