 Global| Sep 03 2014
U.S. Energy Prices Change Little, Remain Sluggish
Summary
The price for a gallon of regular gasoline inched up in the week ended Monday to an average of $3.459 from $3.454 the week before; the latest was off 4.1% y/y. These prices are usually firmer during the week of Labor Day, and this [...]
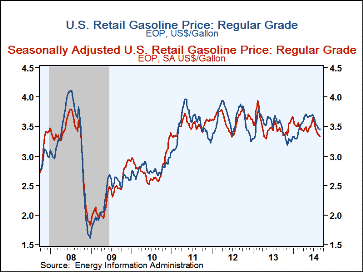
The price for a gallon of regular gasoline inched up in the week ended Monday to an average of $3.459 from $3.454 the week before; the latest was off 4.1% y/y. These prices are usually firmer during the week of Labor Day, and this half-cent move was relatively mild. To account for such seasonal patterns, Haver Analytics constructs factors for adjustment of pump prices. And indeed, the adjusted cost of gasoline fell from $3.353 per gallon a week ago to $3.340 in the Labor Day period.
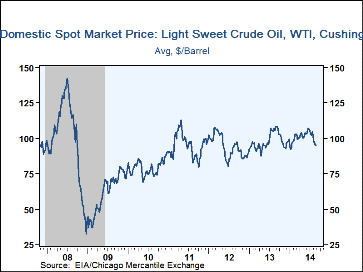
WTI crude oil prices steadied in the week ended August 29 following repeated declines earlier in the month; they edged up to $95.11 per barrel from $94.95 the week before, although that was off 12.2% y/y. The seasonally adjusted price generated by Haver rose just a penny to $95.33 per barrel. Yesterday, prices fell back to $92.92. Brent crude oil prices also rose on average last week to $100.54 per barrel (-12.8% y/y) but then yesterday they were $100.23.
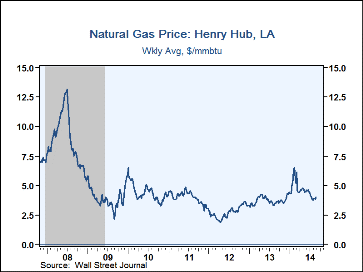
Natural gas prices rebounded last week to a daily average of $3.98 per mmbtu (12.0% y/y) and were the highest since mid-July. Yesterday, September 2, they were $4.01 and had been $4.02 on both Thursday and Friday last week.
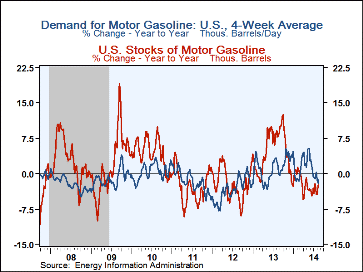
The demand for all petroleum products was up 2.1% in the week ended August 22 versus a year earlier. Gasoline demand fell 1.4% y/y. Residual fuel oil needs, used for heating, fell 28.8% y/y while distillate demand was up 5.2% y/y. Inventories of crude oil and petroleum products eased 0.1% y/y and gasoline inventories were down 2.5% y/y.
The energy price data are reported by the U.S. Department of Energy and can be found in Haver's WEEKLY database. The daily figures are in DAILY and the petroleum demand and inventory figures are in OILWKLY.
| Weekly Energy Prices | 09/01/14 | 08/25/14 | 08/18/14 | Y/Y% | 2013 | 2012 | 2011 |
|---|---|---|---|---|---|---|---|
| Retail Gasoline ($ per Gallon, Regular) | 3.46 | 3.45 | 3.47 | -4.1 | 3.51 | 3.62 | 3.52 |
| Light Sweet Crude Oil, WTI ($ per bbl., WSJ) | 95.11 | 94.95 | 97.17 | -12.2 | 97.95 | 94.20 | 95.14 |
| Natural Gas ($/mmbtu, LA, WSJ) | 3.98 | 3.83 | 3.87 | 12.0 | 3.73 | 2.75 | 3.99 |
Carol Stone, CBE
AuthorMore in Author Profile »Carol Stone, CBE came to Haver Analytics in 2003 following more than 35 years as a financial market economist at major Wall Street financial institutions, most especially Merrill Lynch and Nomura Securities. She had broad experience in analysis and forecasting of flow-of-funds accounts, the federal budget and Federal Reserve operations. At Nomura Securities, among other duties, she developed various indicator forecasting tools and edited a daily global publication produced in London and New York for readers in Tokyo. At Haver Analytics, Carol was a member of the Research Department, aiding database managers with research and documentation efforts, as well as posting commentary on select economic reports. In addition, she conducted Ways-of-the-World, a blog on economic issues for an Episcopal-Church-affiliated website, The Geranium Farm. During her career, Carol served as an officer of the Money Marketeers and the Downtown Economists Club. She had a PhD from NYU's Stern School of Business. She lived in Brooklyn, New York, and had a weekend home on Long Island.
More Economy in Brief
 Global| Feb 05 2026
Charts of the Week: Balanced Policy, Resilient Data and AI Narratives
by:Andrew Cates


