 Global| Nov 10 2020
U.S. Energy Prices Range-bound
Summary
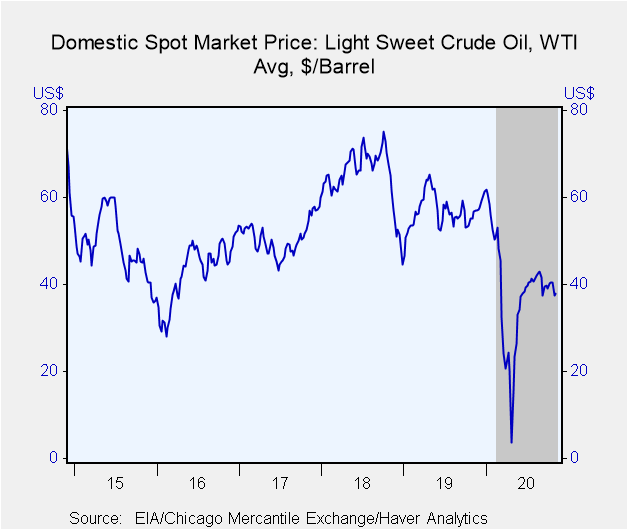
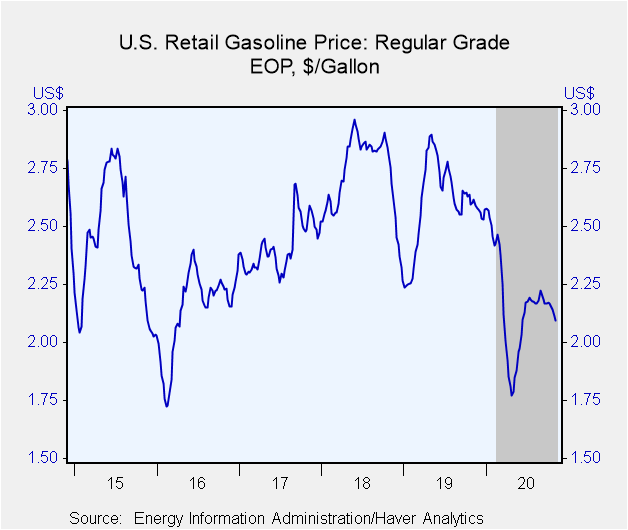
• Crude oil prices rise to $37.82; remain in $37 to $43 range since June. • Gasoline prices edge down. The price for a barrel of West Texas Intermediate crude oil increased to an average of $37.82 per barrel (-33.4% y/y) in the week [...]
• Crude oil prices rise to $37.82; remain in $37 to $43 range since June.
• Gasoline prices edge down.
The price for a barrel of West Texas Intermediate crude oil increased to an average of $37.82 per barrel (-33.4% y/y) in the week ended November 6. It has been range-bound between $37 and $43 since June. Brent crude oil prices rose to an average $40.07 per barrel (-35.7% y/y) last week. Oil prices gained on Monday as news about a potential COVID vaccine spurred optimism about demand.
Regular gasoline prices slipped to $2.096 per gallon (-19.8% y/y) in the week ended November 9. This is the lowest price since mid-June, though prices have been in a very tight range during that time. Haver Analytics adjusts the gasoline price series for usual seasonal variation. The seasonally adjusted price ticked down two cents to $2.103 per gallon last week.
Natural gas prices fell to $2.78/mmbtu (-1.1% y/y) in the week ended November 6, near the level of two weeks ago, but up over a dollar from a month ago. Daily prices declined steadily during the last week.
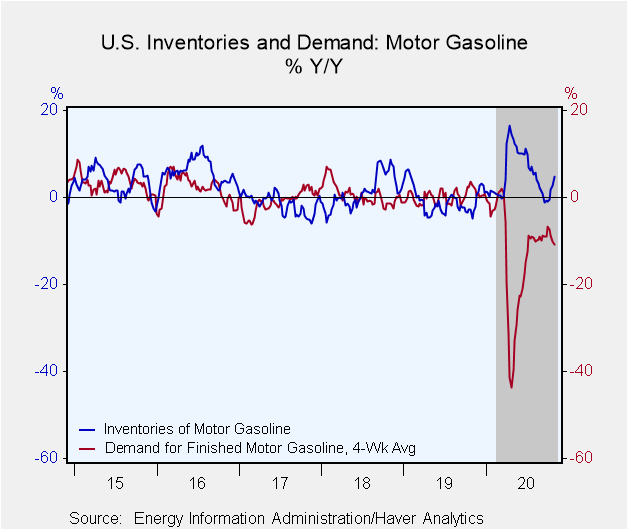
In the four weeks ended October 30, gasoline demand declined 10.9% y/y. Total petroleum product demand fell the same amount. Crude oil input to refineries was down 15.1% y/y in the past four weeks. Gasoline inventories were up 4.8% above a year ago and stocks of all petroleum products were 5.2% higher y/y. The ratio of oil inventories-to-demand jumped to a record 143 days in mid-April. In late October they stood at a still-elevated 110 days.
These data are reported by the U.S. Department of Energy. The price data can be found in Haver's WEEKLY and DAILY databases. Greater detail on prices, as well as the demand, production and inventory data, along with regional breakdowns, are in OILWKLY.
| Weekly Energy Prices | 11/09/20 | 11/02/20 | 10/26/20 | Y/Y % | 2019 | 2018 | 2017 |
|---|---|---|---|---|---|---|---|
| Retail Gasoline ($ per Gallon Regular, Monday Price, End of Period) | 2.10 | 2.11 | 2.14 | -19.8 | 2.57 | 2.27 | 2.47 |
| Light Sweet Crude Oil, WTI ($ per bbl, Previous Week's Average) | 37.82 | 37.39 | 40.49 | -33.4 | 56.91 | 64.95 | 50.87 |
| Natural Gas ($/mmbtu, LA, Previous Week's Average) | 2.78 | 3.09 | 2.74 | -1.1 | 2.57 | 3.18 | 2.99 |
Gerald D. Cohen
AuthorMore in Author Profile »Gerald Cohen provides strategic vision and leadership of the translational economic research and policy initiatives at the Kenan Institute of Private Enterprise.
He has worked in both the public and private sectors focusing on the intersection between financial markets and economic fundamentals. He was a Senior Economist at Haver Analytics from January 2019 to February 2021. During the Obama Administration Gerald was Deputy Assistant Secretary for Macroeconomic Analysis at the U.S. Department of Treasury where he helped formulate and evaluate the impact of policy proposals on the U.S. economy. Prior to Treasury, he co-managed a global macro fund at Ziff Brothers Investments.
Gerald holds a bachelor’s of science from the Massachusetts Institute of Technology and a Ph.D. in Economics from Harvard University and is a contributing author to 30-Second Money as well as a co-author of Political Cycles and the Macroeconomy.
More Economy in Brief
 Global| Feb 05 2026
Charts of the Week: Balanced Policy, Resilient Data and AI Narratives
by:Andrew Cates


