 Global| Feb 21 2019
U.S. Existing Home Sales Continue to Slide
Summary
The National Association of Realtors reported that sales of existing homes fell a greater-than-expected 1.2% in January (-8.5% year-on-year) to 4.940 million units (SAAR). This was the lowest reading since a regulatory-change-driven [...]
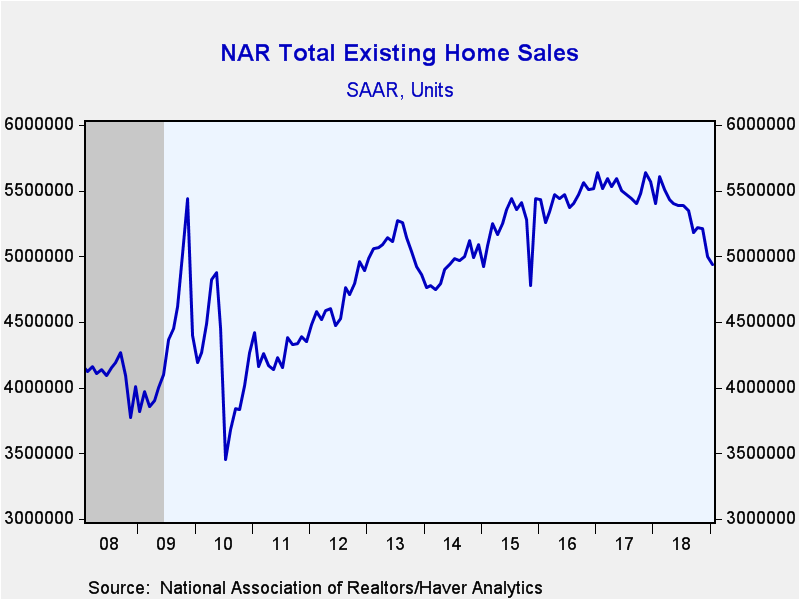
The National Association of Realtors reported that sales of existing homes fell a greater-than-expected 1.2% in January (-8.5% year-on-year) to 4.940 million units (SAAR). This was the lowest reading since a regulatory-change-driven divot in sales in November 2015. The Action Economics Forecast Survey expected sales of 5.00 million units. December’s reading was revised slightly higher to 5.00 million.
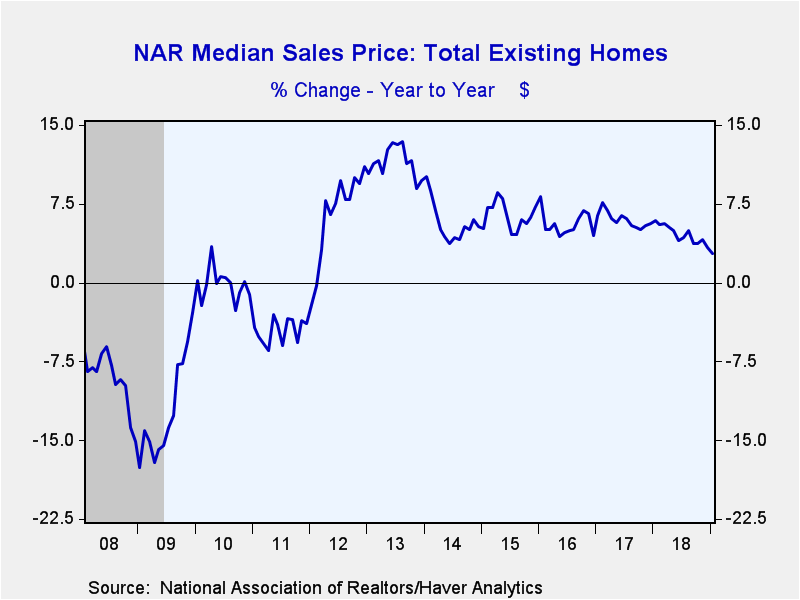
The median price of all existing homes sold declined 2.8% (+2.8% y/y) last month to $247,500. Prices hit a record $273,800 in June. The average sales price fell 2.4% (+1.5% y/y) to $286,800. Sales price data is not seasonally adjusted, so it is not surprising that prices declined month-on-month in January.
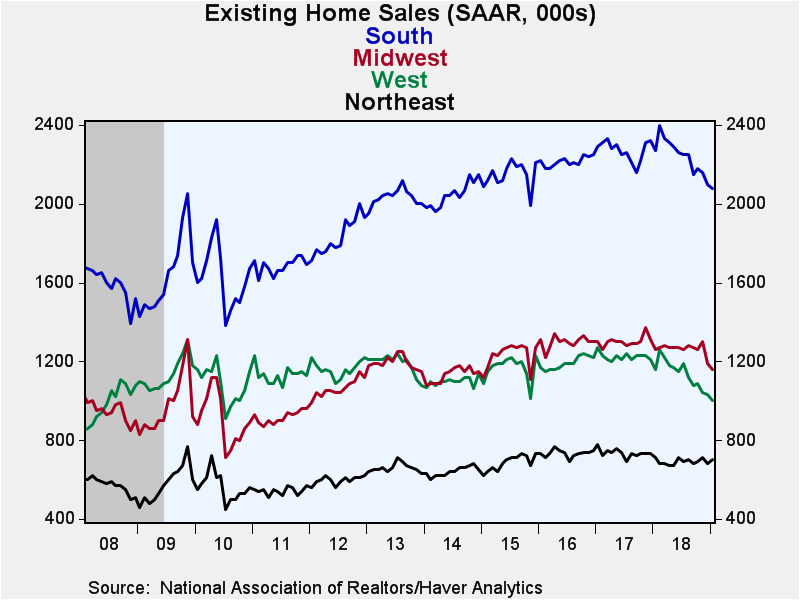
Existing home sales weakened in every region except the Northeast. The West led the decline with a 2.9% drop (-13.8% y/y) to an eight-year low of 1.00 million. The Midwest fell 2.5% (-7.9% y/y) and the South was down 1.0% (-8.4% y/y). Sales in the Northeast gained 2.9% (-1.4% y/y) and have been range-bound around the current 700,000 level for the last few years.
Sales of existing single-family homes declined 1.8% (-8.4% y/y) to 4.37 million units, the weakest reading in over three years. Sales of condos and co-ops rose 3.6% (-9.5% y/y) to 570,000 units, bouncing off December’s six-and-a-half year low.
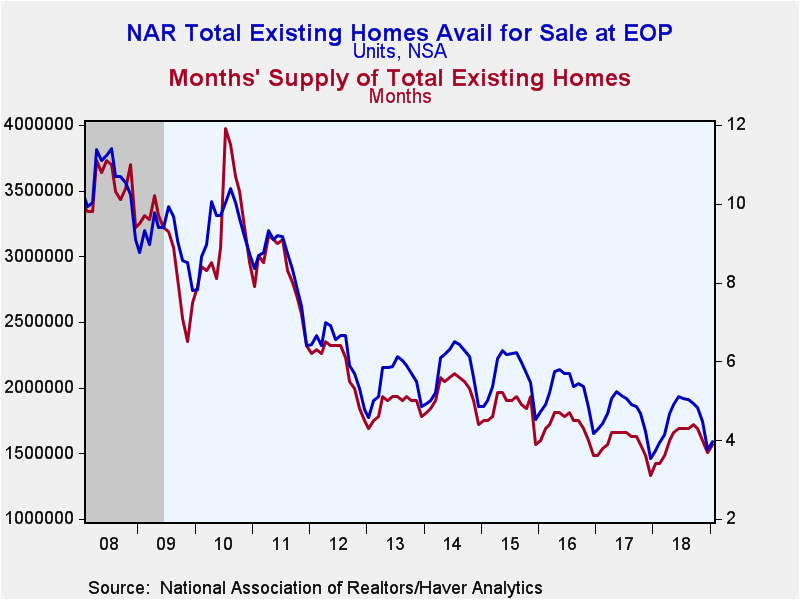
The number of homes on the market increased 4.6% y/y. The months' supply of homes on the market rose to 3.9 up half a month from last January.
The data on existing home sales, prices and affordability are compiled by the National Association of Realtors and can be found in Haver's USECON database. The regional price, affordability and inventory data are available in the REALTOR database. The expectations figure is from the Action Economics Forecast Survey, reported in the AS1REPNA database.
| Existing Home Sales (SAAR, 000s) | Jan | Dec | Nov | Y/Y % | 2018 | 2017 | 2016 |
|---|---|---|---|---|---|---|---|
| Total | 4,940 | 5,000 | 5,210 | -8.5 | 5,341 | 5,531 | 5,437 |
| Northeast | 700 | 680 | 710 | -1.4 | 689 | 735 | 733 |
| Midwest | 1,160 | 1,190 | 1,300 | -7.9 | 1,265 | 1,301 | 1,297 |
| South | 2,080 | 2,100 | 2,160 | -8.4 | 2,246 | 2,270 | 2,215 |
| West | 1,000 | 1,030 | 1,040 | -13.8 | 1,141 | 1,225 | 1,192 |
| Single-Family | 4,370 | 4,450 | 4,630 | -8.4 | 4,742 | 4,907 | 4,822 |
| Median Price Total ($, NSA) | 247,500 | 254,700 | 257,400 | 2.8 | 257,267 | 245,950 | 232,067 |
Gerald D. Cohen
AuthorMore in Author Profile »Gerald Cohen provides strategic vision and leadership of the translational economic research and policy initiatives at the Kenan Institute of Private Enterprise.
He has worked in both the public and private sectors focusing on the intersection between financial markets and economic fundamentals. He was a Senior Economist at Haver Analytics from January 2019 to February 2021. During the Obama Administration Gerald was Deputy Assistant Secretary for Macroeconomic Analysis at the U.S. Department of Treasury where he helped formulate and evaluate the impact of policy proposals on the U.S. economy. Prior to Treasury, he co-managed a global macro fund at Ziff Brothers Investments.
Gerald holds a bachelor’s of science from the Massachusetts Institute of Technology and a Ph.D. in Economics from Harvard University and is a contributing author to 30-Second Money as well as a co-author of Political Cycles and the Macroeconomy.
More Economy in Brief
 Global| Feb 05 2026
Charts of the Week: Balanced Policy, Resilient Data and AI Narratives
by:Andrew Cates


