 Global| Aug 24 2017
U.S. Existing Home Sales Ease, as Prices Also Dip
Summary
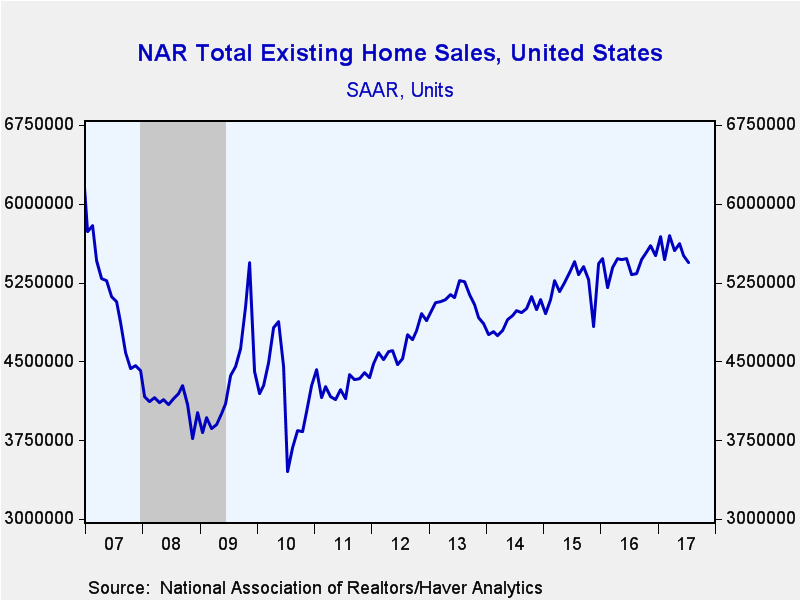
Sales of existing homes fell 1.3% (+2.1% y/y) during July to 5.440 million units (AR) from a slightly revised 5.510 million in June. It was the lowest volume of sales since August 2016. Expectations were for 5.570 million sales in the [...]
Sales of existing homes fell 1.3% (+2.1% y/y) during July to 5.440 million units (AR) from a slightly revised 5.510 million in June. It was the lowest volume of sales since August 2016. Expectations were for 5.570 million sales in the Action Economics Forecast Survey.
Sales of existing single-family homes fell 0.8% (+1.7% y/y) to 4.840 million while sales of co-ops and condos dropped 4.8% (+5.3% y/y) to 600,000.
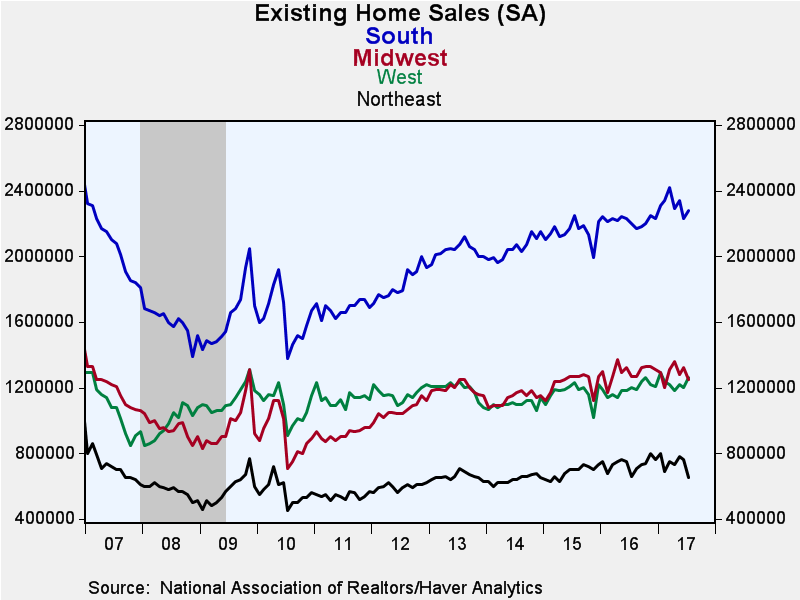
By region, total existing home sales fell the most in the northeast, 14.5% (-1.5% y/y), to 650,000 from 760,000 in June. Sales in the Midwest fell 5.3% (-1.6% y/y) to 1.250 million from 1.320 million. But sales improved in the west, 5.0% (+5.0%) to 1.260 million from 1.200 million, and those in the south gained 2.2% (+3.6% y/y) in July to 2.280 million from 2.230 million in June.
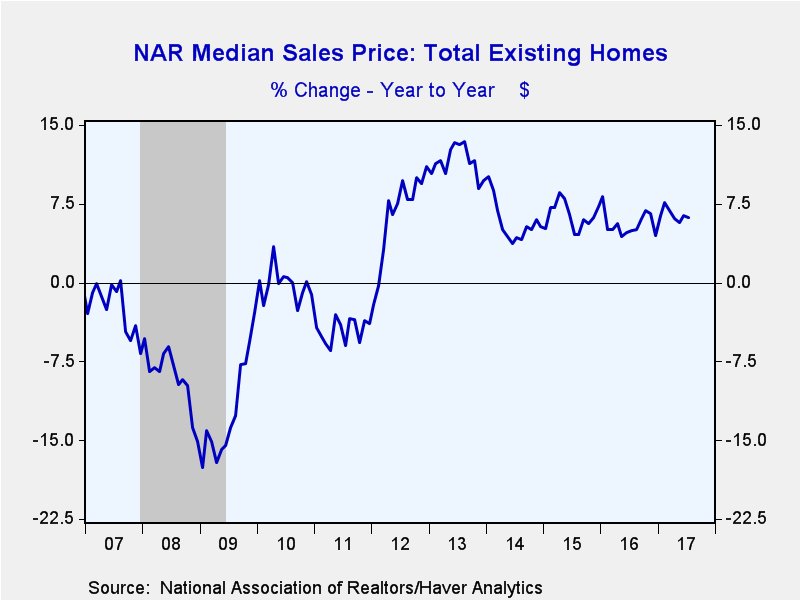
The median price of all existing homes sold decreased 1.9% (6.2% y/y) to $258,300.
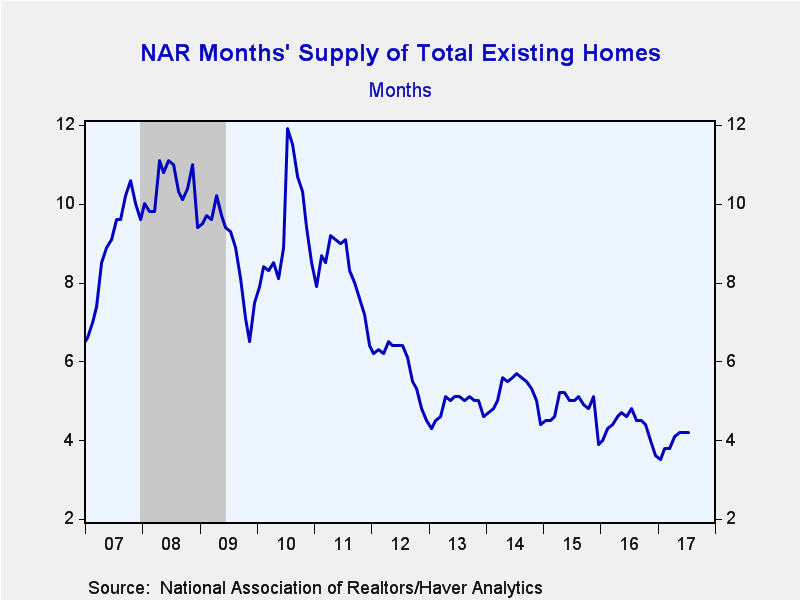
The number of homes on the market was down 1.0% (-9.0% y/y) to 1.92 million. There was a 4.2 months' supply of those homes available for sale, up from a recent low of 3.5 months in January, but down from 4.8 months a year ago.
The data on existing home sales, prices and affordability are compiled by the National Association of Realtors and can be found in Haver's USECON database. The regional price, affordability and inventory data are available in the REALTOR database. The expectations figure is from the Action Economics Forecast Survey, reported in the AS1REPNA database.
| Existing Home Sales (SAAR, 000s) | Jul | Jun | May | Y/Y % | 2016 | 2015 | 2014 |
|---|---|---|---|---|---|---|---|
| Total | 5,440 | 5,510 | 5,620 | 2.1 | 5,440 | 5,234 | 4,923 |
| Northeast | 650 | 760 | 780 | -1.5 | 735 | 685 | 641 |
| Midwest | 1,250 | 1,320 | 1,280 | -1.6 | 1,296 | 1,231 | 1,134 |
| South | 2,280 | 2,230 | 2,340 | 3.6 | 2,217 | 2,148 | 2,048 |
| West | 1,260 | 1,200 | 1,220 | 5.0 | 1,193 | 1,170 | 1,100 |
| Single-Family | 4,840 | 4,880 | 4,980 | 1.7 | 4,828 | 4,624 | 4,333 |
| Median Price Total ($, NSA) | 258,300 | 263,300 | 252,500 | 6.2 | 232,067 | 219,867 | 206,708 |
Carol Stone, CBE
AuthorMore in Author Profile »Carol Stone, CBE came to Haver Analytics in 2003 following more than 35 years as a financial market economist at major Wall Street financial institutions, most especially Merrill Lynch and Nomura Securities. She had broad experience in analysis and forecasting of flow-of-funds accounts, the federal budget and Federal Reserve operations. At Nomura Securities, among other duties, she developed various indicator forecasting tools and edited a daily global publication produced in London and New York for readers in Tokyo. At Haver Analytics, Carol was a member of the Research Department, aiding database managers with research and documentation efforts, as well as posting commentary on select economic reports. In addition, she conducted Ways-of-the-World, a blog on economic issues for an Episcopal-Church-affiliated website, The Geranium Farm. During her career, Carol served as an officer of the Money Marketeers and the Downtown Economists Club. She had a PhD from NYU's Stern School of Business. She lived in Brooklyn, New York, and had a weekend home on Long Island.
More Economy in Brief
 Global| Feb 05 2026
Charts of the Week: Balanced Policy, Resilient Data and AI Narratives
by:Andrew Cates


