 Global| May 22 2012
U.S. Existing Home Sales Improve Modestly; Prices Gain
Summary
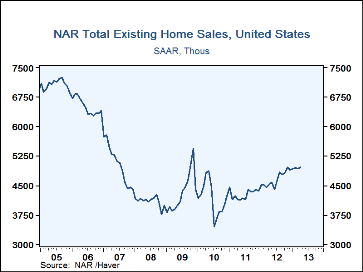
Existing home sales gained 0.6% in April (+9.7% y/y) to a 4.970M annual rate, according to data compiled by the National Association of Realtors; March sales were revised upward and now show a marginal 0.2% decrease instead of 0.6% [...]
 Existing home sales gained 0.6% in April (+9.7% y/y) to a 4.970M annual rate, according to data compiled by the National Association of Realtors; March sales were revised upward and now show a marginal 0.2% decrease instead of 0.6% initially reported. April sales still fell short of Consensus expectations, which projected 4.99M. Sales of existing single-family homes alone were firmer, increasing 1.2% to 4.380M (+9.0% y/y) after a flat performance in March. (These data have a longer history than the total sales series.) Sales of condos and co-ops fell 3.3% m/m to 0.590M, up 15.7% y/y.
Sales rose in three regions. The South was strongest in April, with a 2.0% gain m/m to 2.010M sales. The West had a 1.7% gain to 1.200M and the Northeast, 1.6% to 0.640M. Only the Midwest had a decline, 3.4% to 1.120M (all amounts seasonally adjusted annual rates).
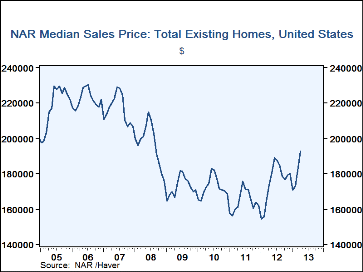
The median price of an existing home rose 4.8% (11.0% y/y) to $192,800. This is the highest price reading since August 2008, just as the financial crisis was reaching its most intense. The peak was $230,300 in July 2006.
The supply of homes on the market came back up to 5.2 months at the end of April from 4.7 months for March. The number of homes for sale rose to 2.160M from 1.930M in March, an increase of 11.8%, but down 13.6% on the year. For single-family homes, the April inventory stood at 5.3 months' worth of sales, following 4.7 months for March; the number of homes for sale at end-April was 1.920M, up 13.6% in the month, but still 11.9% below a year ago.
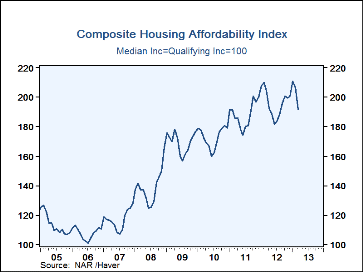
Reported earlier this month, the composite index of home price affordability for March fell 6.3% y/y. Mortgage payments went up to 13.0% of income in the month, accompanied by an increase in the mortgage rate to 3.66% from 3.56% for February, as well as a rise in the median home price that month.
The data on existing home sales, prices and affordability can be found in Haver's USECON database. The regional price, affordability and inventory data are available in the REALTOR database. The expectations figure is in the AS1REPNA database.
| Existing Home Sales (Thous, SAAR) | |||||||
|---|---|---|---|---|---|---|---|
| Apr | Mar | Feb | Y/Y% | 2012 | 2011 | 2010 | |
| Total | 4,970 | 4,940 | 4,950 | 10.3 | 4,661 | 4,278 | 4,183 |
| Northeast | 640 | 630 | 630 | 4.9 | 596 | 543 | 563 |
| Midwest | 1,120 | 1,160 | 1,140 | 9.8 | 1067 | 918 | 909 |
| South | 2,010 | 1,970 | 1,980 | 14.9 | 1,833 | 1,683 | 1,626 |
| West | 1,200 | 1,180 | 1,200 | 4.3 | 1,165 | 1,133 | 1,084 |
| Single-Family Sales | 4,380 | 4,330 | 4,330 | 9.0 | 4,130 | 3,793 | 3,705 |
| Median Price Total ($, NSA) | 192,800 | 183,900 | 173,200 | 11.0 | 175,442 | 164,542 | 172,442 |
Carol Stone, CBE
AuthorMore in Author Profile »Carol Stone, CBE came to Haver Analytics in 2003 following more than 35 years as a financial market economist at major Wall Street financial institutions, most especially Merrill Lynch and Nomura Securities. She had broad experience in analysis and forecasting of flow-of-funds accounts, the federal budget and Federal Reserve operations. At Nomura Securities, among other duties, she developed various indicator forecasting tools and edited a daily global publication produced in London and New York for readers in Tokyo. At Haver Analytics, Carol was a member of the Research Department, aiding database managers with research and documentation efforts, as well as posting commentary on select economic reports. In addition, she conducted Ways-of-the-World, a blog on economic issues for an Episcopal-Church-affiliated website, The Geranium Farm. During her career, Carol served as an officer of the Money Marketeers and the Downtown Economists Club. She had a PhD from NYU's Stern School of Business. She lived in Brooklyn, New York, and had a weekend home on Long Island.
More Economy in Brief
 Global| Feb 05 2026
Charts of the Week: Balanced Policy, Resilient Data and AI Narratives
by:Andrew Cates


