Global| Dec 25 2009
U.S. Existing Home Sales Sink ButPrices Firm
by:Tom Moeller
|in:Economy in Brief
Summary
The National Association of Realtors reported that sales of existing homes fell 16.7% from November as a since-extended tax credit for first home buyers was due to expire. The decline to 5.450M units (SAAR) followed a little-revised [...]
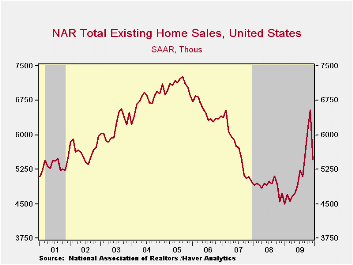 The
National
Association of Realtors reported that sales of existing homes
fell 16.7% from November as a since-extended tax credit for first home
buyers was due to expire. The decline to 5.450M units (SAAR) followed a
little-revised 7.4% rise and similarly strong gains back through July.
The fall in December home sales greatly exceeded Consensus expectations
for decline to 5.90M.
The
National
Association of Realtors reported that sales of existing homes
fell 16.7% from November as a since-extended tax credit for first home
buyers was due to expire. The decline to 5.450M units (SAAR) followed a
little-revised 7.4% rise and similarly strong gains back through July.
The fall in December home sales greatly exceeded Consensus expectations
for decline to 5.90M.
For all of last year, the tax credit, along with improved affordability, raised home sales by 5.5% from 2008. However, that recovery made up only a piece of larger declines during the prior three years. As a result, total sales last year remained 27.0% below the 2005 peak.
Total sales include sales of condos and co-ops. Sales of existing single-family homes alone fell 16.8% from November to 4.790M but remained up 18.3% from the January low. For all of 2009, sales rose 5.4% after sharp declines during the prior three years. (These data have a longer history than the total sales series). Sales of condos and co-ops fell 15.4% m/m but were up by one-third from the November '08 low.
Sales have been helped by a recently extended tax credit for first-time home buyers. The credit of up to $8,000 now runs though April 30. Additionally, a new credit of up to $6,500 is available to some existing home owners who move. The full details of the home-buyer tax credit can be found here.
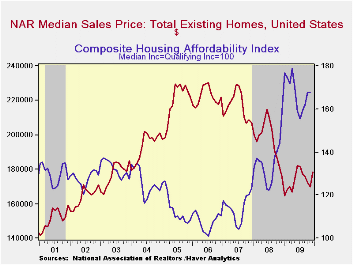
The median price of all existing homes jumped 4.9% last month to the highest level since July. The median price for a single-family home alone was strong, rising 4.8% to $177,500 (1.4% y/y). For the year as a whole, however, weakness in home sales pulled prices lower. The 11.6% decline from 2007 was the third consecutive year of decline. Prices remained down 22% from the 2007 monthly peak. Price weakness sharply raised home affordability; by 7.8% since July and by two-thirds from the 2006 low. The median family income for existing home buyers was $60,034 and mortgage payments amounted to 14.9% of that total.
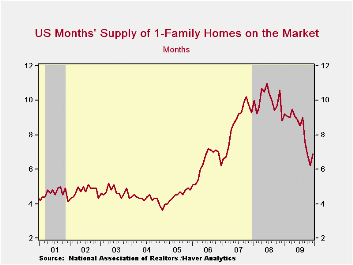
The number of unsold homes (single-family & co-ops) for sale fell a sharp 6.6% (-11.1% y/y) during December to the lowest level since March 2006. At the current sales rate there was a 7.2 months' supply of homes on the market, near the lowest since late 2006. The latest figure was down from a high of 11.3 months during April of 2008. For single-family homes, the inventory fell to a 6.9 months' supply, the lowest since March 2007.
The data on existing home sales, prices and affordability can be found in Haver's USECON database. The regional price, affordability and inventory data is available in the REALTOR database.
Alt-A: The Forgotten Segment of the Mortgage Market from the Federal Reserve Bank of St. Louis is available here.
| Existing Home Sales (Thous, SAAR) | December | November | October | Dec. Y/Y | 2009 | 2008 | 2007 |
|---|---|---|---|---|---|---|---|
| Total | 5,450 | 6,540 | 6,090 | 15.0% | 5,164 | 4,893 | 5,674 |
| Northeast | 910 | 1,130 | 1,060 | 21.3 | 863 | 845 | 1,010 |
| Midwest | 1,150 | 1,550 | 1,430 | 8.5 | 1,168 | 1,130 | 1,331 |
| South | 2,010 | 2,400 | 2,280 | 15.5 | 1,913 | 1,860 | 2,243 |
| West | 1,380 | 1,450 | 1,320 | 15.0 | 1,216 | 1,064 | 1,095 |
| Single-Family | 4,790 | 5,760 | 5,320 | 12.7 | 4,573 | 4,341 | 4,960 |
| Median Price, Total, $ (NSA) | 178,300 | 170,000 | 172,200 | 1.5 | 173,458 | 197,233 | 216,633 |
by Robert Brusca January 25, 2010
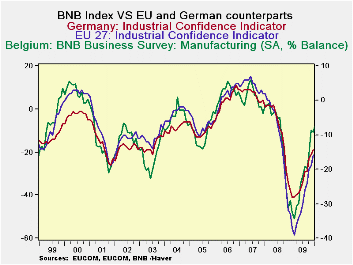
Belgium is a small open EMU economy that tends to lead the way in the Euro-business cycle. It is headed higher once again in January. The chart above shows that the Belgium MFG index usually surges early and peaks ahead of the indices for Germany and EMU. At this point in the cycle Belgium is doing that again. After leading the parade higher, the Belgian National Bank index of MFG paused, but has resumed its move higher. That’s good news for Europe.
Belgium is a small open economy that sits at the cross roads of Euro-activity. Its index is usually the first released among the Zone members so it is a natural as a bellwether from a timing standpoint. To underscore that point the index reliably tends to lead the Europe’s cycle hence paying attention to this small country’s economic data makes considerable sense.
Just today Germany sharply revised up its orders in November that it had released on Friday, leading to upward revisions to November EMU orders as well. Now in fresh data from January, the Belgian bank index is continuing to gain momentum. The overall Belgian index has improved its reading for the 10th month in a row. Manufacturing is back to improving after a one-month misstep; MFG has improved in eight of the last ten months.
The Belgian index places MFG in the top two thirds of its range. Business services stand in the top 40% of its range. Wholesaling and retailing are near mid-range in the 47th percentile. Construction is lagging badly in Belgium standing in the eighth percentile of its range.
For MFG the orders assessment is very up beat with both domestic and foreign orders in the 60th and 70th percentiles of their respective ranges. Like Germany and EMU, Belgium shows that foreign orders are the greater source for growth. Production stands even higher in the 75th percentile of its range.
On balance the Belgian Bank index is a bit reassuring ahead of the release of the monthly German reports form Zew and the IFO as well as the EMU-wide releases from the European Commission. There has been some sputtering in European and in US data recently. Does the Belgian index point to a re-emergence of up beat reports for the month ahead? We shall soon see, but based on historic relationships, the best bet is that it does point to better euro-reports for the month ahead.
| Belgium National Bank Indices | ||||||||
|---|---|---|---|---|---|---|---|---|
| Jan-10 | Dec-09 | Nov-09 | 3Mo Change | 6MO Change | 12Mo Change | Percentile | ||
| Total Ind | -7.0 | -7.9 | -8.8 | 7.2 | 15.8 | 20.6 | 60.5% | |
| MFG | -7.2 | -9.3 | -8.6 | 8.6 | 14.7 | 21.8 | 67.2% | |
| Prod | 7.0 | 4.0 | 6.0 | -2.0 | 13.0 | 28.0 | 75.5% | |
| Dom Ord | -4.0 | -9.0 | -9.0 | 5.0 | 6.0 | 13.0 | 60.8% | |
| FGN Ord | 8.0 | -3.0 | -3.0 | -1.0 | 15.0 | 43.0 | 70.3% | |
| Prices | 3.0 | -9.0 | -8.0 | 11.0 | 20.0 | 12.0 | 66.7% | |
| Current assess | ||||||||
| Tot Ord | -34.0 | -38.0 | -36.0 | 2.0 | 15.0 | 15.0 | 33.3% | |
| Fgn Ord | -34.0 | -38.0 | -34.0 | 4.0 | 15.0 | 19.0 | 38.0% | |
| Inventories | -13.0 | -12.0 | -10.0 | -8.0 | -9.0 | -11.0 | 0.0% | |
| Wholesale& Retail | -9.0 | -6.3 | -10.0 | 8.1 | 8.6 | 18.3 | 47.5% | |
| Construction | -15.7 | -9.1 | -10.0 | -5.0 | 0.2 | -0.2 | 8.0% | |
| Business Services | 3.1 | -1.4 | -7.8 | 13.0 | 38.6 | 37.1 | 59.2% | |
| Comparisons: | Changes lag one month | 1-Mo Lag | ||||||
| EU Index: Industry | #N/A | -16.0 | -19.0 | 8.0 | 9.0 | 17.0 | 48.9% | |
| Gy Index:Industry | #N/A | -19.0 | -21.0 | 10.0 | 10.0 | 15.0 | 42.3% | |
| Compare: BNB Index | -- | -- | -- | 9.9 | 10.3 | 20.9 | Since Jan-96 | |
by Louise Curley December 25, 2009
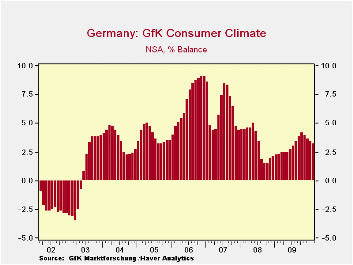 On
the basis of its January survey,
GfK* is forecasting that its economic climate measure will decline for
the fourth month in February to 3.2% from 3.4%, as shown in the first
chart. This marks the fourth month of decline.
On
the basis of its January survey,
GfK* is forecasting that its economic climate measure will decline for
the fourth month in February to 3.2% from 3.4%, as shown in the first
chart. This marks the fourth month of decline.
The January
survey has shown that German consumers continue to be less enthusiastic
about the general economy and their own prospects than they were in
September/October of last year. Even though the survey shows
an increase of 4.2 percentage points from December to January in the
percent balance of those who intend to increase their spending, it is,
at 25.4%, still below the recent peak of 36.5% reached in September of
last year. GfK suggested that the proliferation of special
sales and discounted merchandise may have had a positive effect on the
propensity to consume that has over come the negative effect of poor
income prospects. 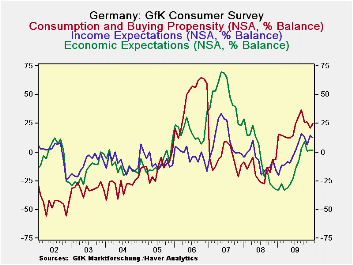 The components of the survey are shown in
the second chart.
The components of the survey are shown in
the second chart.
Although there has been a substantial improvement in the components of the survey since the low points reached at the end of 2008 and early 2009, only income expectations are at all close to the all time peaks reached in late 2006 and mid 2007. The percent balance on income expectations was 12.5% in January, 21.1 percentage points below the all time peak of 33.6%. The comparable figures for economic expectations were 1.5%, 67.5 percentage points below the all time peak of 69.0% and for the propensity to consume 25.4%, 39.0 percentage points below the all time peak of 64.4% These data are shown in the second chart and in the table below. *Geschellschaft fur Konsumforshung. (Company for Consumer Research)
| Feb 10 | Jan 10 | Dec 09 | Recent Peak | Date | Recent Trough | Date | Chg from Trough | All Time Peak | Date | Chg Present from Peak | |
|---|---|---|---|---|---|---|---|---|---|---|---|
| Propensity to Consume | -- | 25.4 | 21.2 | 36.5 | Sep 09 |
-27.9 | Aug 08 |
53.3 | 64.4 | Oct 06 |
-39.0 |
| Income Expectations | -- | 12.5 | 15.0 | 16.0 | Sep 09 |
-20.5 | Jan 09 |
33.0 | 33.6 | May 07 |
-21.1 |
| Economic Expectations | -- | 1.5 | 1.7 | 8.7 | Oct 09 |
-32.9 | Jan 09 |
34.4 | 69.0 | Jun 07 |
-67.5 |
| Consumer Climate | 3.2 | 3.4 | 3.6 | 4.2 | Oct 09 |
1.5 | Sep/ Oct08 |
4.7 | 9.1 | Dec 06 |
-5.9 |

Tom Moeller
AuthorMore in Author Profile »Prior to joining Haver Analytics in 2000, Mr. Moeller worked as the Economist at Chancellor Capital Management from 1985 to 1999. There, he developed comprehensive economic forecasts and interpreted economic data for equity and fixed income portfolio managers. Also at Chancellor, Mr. Moeller worked as an equity analyst and was responsible for researching and rating companies in the economically sensitive automobile and housing industries for investment in Chancellor’s equity portfolio. Prior to joining Chancellor, Mr. Moeller was an Economist at Citibank from 1979 to 1984. He also analyzed pricing behavior in the metals industry for the Council on Wage and Price Stability in Washington, D.C. In 1999, Mr. Moeller received the award for most accurate forecast from the Forecasters' Club of New York. From 1990 to 1992 he was President of the New York Association for Business Economists. Mr. Moeller earned an M.B.A. in Finance from Fordham University, where he graduated in 1987. He holds a Bachelor of Arts in Economics from George Washington University.
More Economy in Brief
 Global| Mar 26 2026
Charts of the Week: A Supply-Constrained World Comes into Sharper Focus
by:Andrew Cates