Global| Sep 25 2007
U.S. Existing Home Sales Weakness Accelerates in the West
Summary
As of last month, the Northeast had seemed to stabilize. So had the Midwest. In the South conditions had still been easing but with a hint of flatness month/month in July. But in August the South saw sales fall again and the West saw [...]
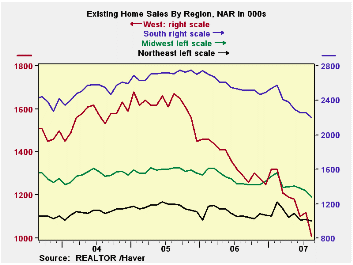
As of last month, the Northeast had seemed to stabilize. So had the Midwest. In the South conditions had still been easing but with a hint of flatness month/month in July. But in August the South saw sales fall again and the West saw the bottom fall out of an already weak market. The drop off in the West is simply stunning. It is the largest drop in this episode of declining sales. What we find is that sales have pulled back sharply in this period when mortgage availability came into question in the middle of the financial sector mortgage-led melt down. Since Jumbo mortgages were one of the products at issue in this mini-crisis, it is not surprising to find that the West, California’s region where the jumbo mortgage is also the norm, is the region that is most affected in August. The Midwest and Northeast are still under pressure, the South appears to see a continued and fairly ongoing fall off, but the West is a disaster.
The Northeast and Midwest are holding their year/year declines to about 10%, the South is off by 13% but the West is now down by nearly 22% year-over-year.
While the median price has slipped to $224,500, that is an erosion of only about 2.5% from its recent peak. The problems so far do not seem to be crushing home prices. The home sales market is doing its usual thing which is to become less liquid and to maintain house prices.
We now see vast regional differences in terms of what has happened over the past year. The West, the region with the highest home prices has been hit the hardest. But the Northeast with the second highest prices has been the most insulated. The seize-up is simply not just about high-priced homes.
The Northeast is more fully developed and probably has less competition from tracts of new homes. Plus inflows of monies from nonresidents have helped to prop up prices in some the East coast housing markets giving them some resiliency.
Summing Up:Still the facts are clear and housing is in the soup. The financial mess has had spillover into the house sales market - not surprisingly. The report was weak enough to inject new life into the bond market where the price of bonds had been selling off since the Fed started its easing process. The question markets are grappling with now is how weak is the economy really and how far will the Fed choose to go? There is tension between those thinking that the Fed will overdo it since economy is not really that weak and those who think that the economy is weak and will need more help. For the moment stocks are assuming that there will be growth from one channel or another. The macro picture is muddied by the GM strike that could weaken things a lot more if that strike drags on.
| Existing Home Sales Summary | |||||
|---|---|---|---|---|---|
| (Existing Home Sales: In Thousands' -- National Association of Realtors) | |||||
| Month | Total | North-East | Mid-West | South | West |
| Aug.07 | 5,500 | 1000 | 1280 | 2200 | 1010 |
| Jul.07 | 5,750 | 1020 | 1350 | 2260 | 1120 |
| Jun.07 | 5,760 | 1010 | 1380 | 2260 | 1100 |
| May.07 | 5,980 | 1090 | 1410 | 2300 | 1180 |
| Apr.07 | 6,010 | 1040 | 1400 | 2380 | 1190 |
| Mar.07 | 6,150 | 1140 | 1390 | 2410 | 1210 |
| Feb.07 | 6,680 | 1220 | 1560 | 2570 | 1320 |
| Jan.07 | 6,440 | 1060 | 1520 | 2540 | 1320 |
| Dec.06 | 6,270 | 1070 | 1460 | 2490 | 1250 |
| Nov.06 | 6,250 | 1080 | 1420 | 2470 | 1280 |
| Oct.06 | 6,270 | 1030 | 1420 | 2520 | 1300 |
| Sep.06 | 6,230 | 1040 | 1420 | 2520 | 1260 |
| Aug.06 | 6,310 | 1060 | 1430 | 2520 | 1290 |
| Percent Changes: Existing Home Sales | |||||
| Mo/Mo% | Total | North-East | Mid-West | South | West |
| Aug.07 | -4.3% | -2.0% | -5.2% | -2.7% | -9.8% |
| Jul.07 | -0.2% | 1.0% | -2.2% | 0.0% | 1.8% |
| Jun.07 | -3.7% | -7.3% | -2.1% | -1.7% | -6.8% |
| May.07 | -0.5% | 4.8% | 0.7% | -3.4% | -0.8% |
| 3-Mo:ar | -32.1% | -33.0% | -36.9% | -17.4% | -57.6% |
| 6-mo:ar | -35.3% | -36.1% | -35.9% | -28.8% | -47.0% |
| 1-Year | -12.8% | -5.7% | -10.5% | -12.7% | -21.7% |
| Prices: | Median Prices | ||||
| One Mo: | -0.1% | -0.7% | 2.2% | -1.7% | 0.6% |
| One Year: | -0.6% | 5.9% | -1.8% | -3.2% | 0.9% |

Robert Brusca
AuthorMore in Author Profile »Robert A. Brusca is Chief Economist of Fact and Opinion Economics, a consulting firm he founded in Manhattan. He has been an economist on Wall Street for over 25 years. He has visited central banking and large institutional clients in over 30 countries in his career as an economist. Mr. Brusca was a Divisional Research Chief at the Federal Reserve Bank of NY (Chief of the International Financial markets Division), a Fed Watcher at Irving Trust and Chief Economist at Nikko Securities International. He is widely quoted and appears in various media. Mr. Brusca holds an MA and Ph.D. in economics from Michigan State University and a BA in Economics from the University of Michigan. His research pursues his strong interests in non aligned policy economics as well as international economics. FAO Economics’ research targets investors to assist them in making better investment decisions in stocks, bonds and in a variety of international assets. The company does not manage money and has no conflicts in giving economic advice.
More Economy in Brief
 Global| Feb 05 2026
Charts of the Week: Balanced Policy, Resilient Data and AI Narratives
by:Andrew Cates