 Global| Dec 04 2020
U.S. Factory Orders Continue to Grow; Shipments Also Expand
Summary
• Factory orders rise for a sixth straight month. • Shipments extend uptrend. • Order backlogs continue to decline while inventories turn modestly higher. Manufacturing activity expanded further in October, with new orders increasing [...]
• Factory orders rise for a sixth straight month.
• Shipments extend uptrend.
• Order backlogs continue to decline while inventories turn modestly higher.
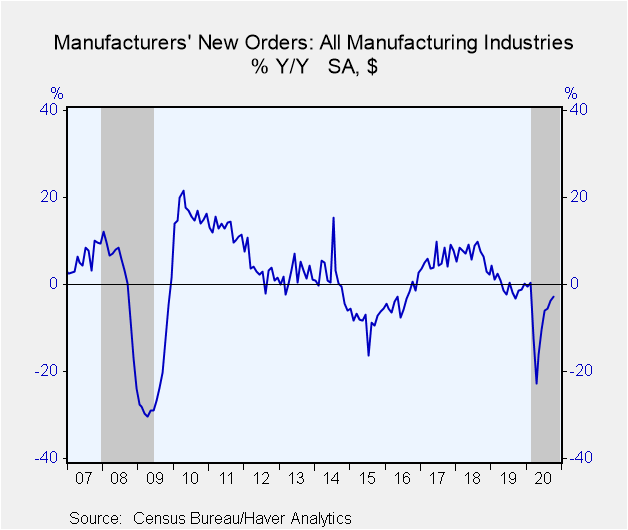
Manufacturing activity expanded further in October, with new orders increasing for a sixth straight month, this time by 1.0% (-2.8% y/y) after September's 1.3%, revised from 1.1%. The Action Economics Forecast Survey had expected an 0.8% rise in October.
Orders in the durable goods sector rose 1.3% m/m, which was down 0.2% y/y. Fabricated metal products had the largest increase, 2.3%, and transportation equipment orders increased 1.4%. Shipments of durable goods rose 1.3% (+1.2% y/y). For more details on the durable goods sector, see last week's report.
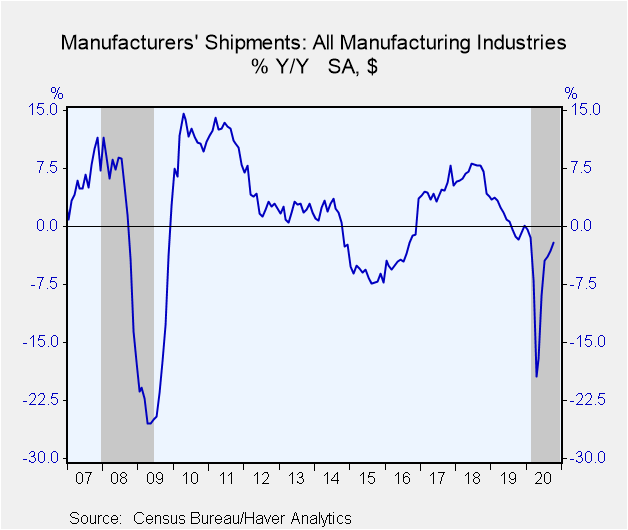
Factory shipments rose 1.0% (-2.1% y/y) in October. Nondurable goods shipments, which equal nondurable goods orders, increased 0.7% (-5.3% y/y) after rising 0.5% during September. Among the largest nondurable goods producers, basic chemical shipments rose 1.1% in October (2.0% y/y), and shipments from petroleum refineries rose 0.8% (-27.6% y/y).
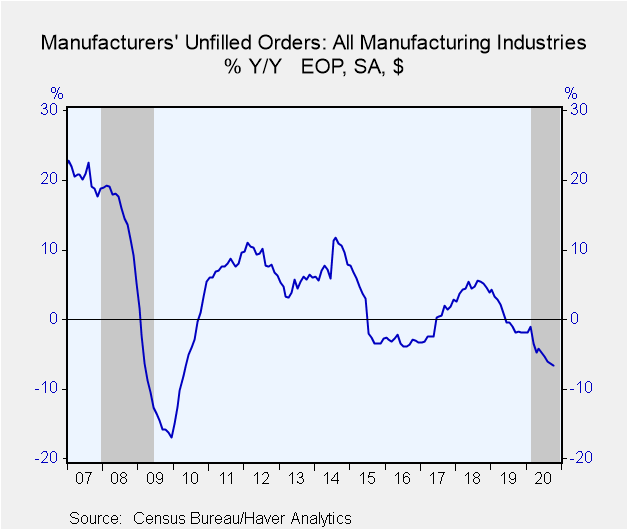
Unfilled orders of durable goods eased 0.2% for a second month (October -6.6% y/y) and the eighth consecutive month without an increase. But the weakness was heavily concentrated in transportation equipment, for which order backlogs constitute 67% of the overall total for durable goods; In October, that industry group saw backlogs fall 0.6% (10.2% y/y), mostly in aircraft. Other industries saw their backlogs grow by 0.5% (+1.6% y/y)
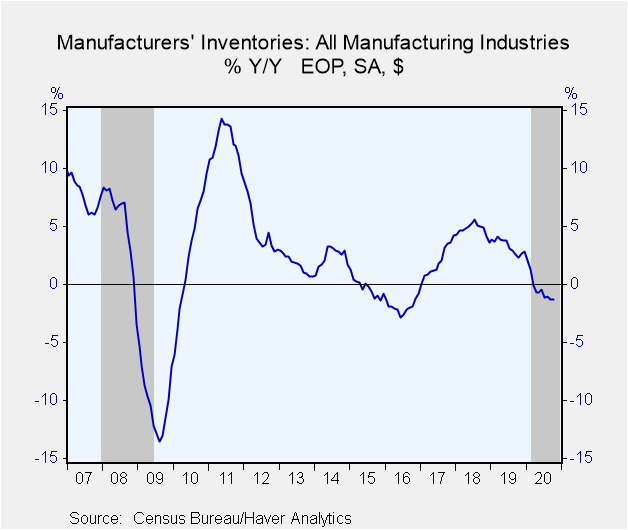
Inventories of manufactured products rose 0.2% in October (-1.3% y/y), following a 0.1% dip in September. Durable goods stocks rose 0.2% (+0.5% y/y) and those for nondurable goods rose 0.1% (-3.9% y/y) Transportation increased 0.4% (7.1% y/y). Durable goods inventories outside of transportation rose 0.2% (--2.8% y/y). Nondurable goods inventories edged up 0.1% (-3.9% y/y) even as petroleum refinery inventories continued to decline, falling 1.9% in the month (-22.3% y/y). Chemical industry stocks rose 0.6% (+0.8% y/y).
All these factory sector figures and West Texas intermediate oil prices are available in Haver's USECON database.
| Factory Sector (% chg) - NAICS Classification | Oct | Sep | Aug | Oct Y/Y | 2019 | 2018 | 2017 |
|---|---|---|---|---|---|---|---|
| New Orders | 1.0 | 1.3 | 0.6 | -2.8 | -0.1 | 6.8 | 5.9 |
| Shipments | 1.0 | 0.5 | 0.3 | -2.1 | 1.0 | 6.6 | 4.7 |
| Unfilled Orders | -0.2 | -0.2 | -0.6 | -6.6 | -1.8 | 3.9 | 2.8 |
| Inventories | 0.2 | -0.1 | 0.0 | -1.3 | 2.8 | 3.6 | 4.2 |
Carol Stone, CBE
AuthorMore in Author Profile »Carol Stone, CBE came to Haver Analytics in 2003 following more than 35 years as a financial market economist at major Wall Street financial institutions, most especially Merrill Lynch and Nomura Securities. She had broad experience in analysis and forecasting of flow-of-funds accounts, the federal budget and Federal Reserve operations. At Nomura Securities, among other duties, she developed various indicator forecasting tools and edited a daily global publication produced in London and New York for readers in Tokyo. At Haver Analytics, Carol was a member of the Research Department, aiding database managers with research and documentation efforts, as well as posting commentary on select economic reports. In addition, she conducted Ways-of-the-World, a blog on economic issues for an Episcopal-Church-affiliated website, The Geranium Farm. During her career, Carol served as an officer of the Money Marketeers and the Downtown Economists Club. She had a PhD from NYU's Stern School of Business. She lived in Brooklyn, New York, and had a weekend home on Long Island.
More Economy in Brief
 Global| Feb 05 2026
Charts of the Week: Balanced Policy, Resilient Data and AI Narratives
by:Andrew Cates


