 Global| Sep 19 2016
U.S. Financial Accounts Mixed as Households Borrowing More and Businesses Less
Summary
Total borrowing in the U.S. was $2,443 billion at a seasonally adjusted annual rate in Q2, down from $2,966 billion in Q1, according to the Financial Accounts of the U.S., released Friday by the Federal Reserve Board. The Q2 amount [...]
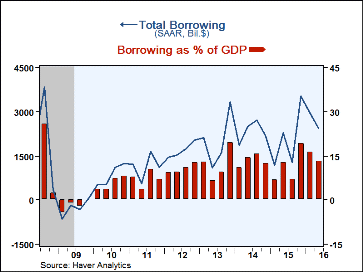
Total borrowing in the U.S. was $2,443 billion at a seasonally adjusted annual rate in Q2, down from $2,966 billion in Q1, according to the Financial Accounts of the U.S., released Friday by the Federal Reserve Board. The Q2 amount represented 13.3% of GDP, compared to 16.2% in Q1 and similar to the general 10-13% range that has prevailed since 2012. Notably, in the five years before the Great Recession, this ratio averaged almost 29% and peaked at 36.4% in 2007-Q3.
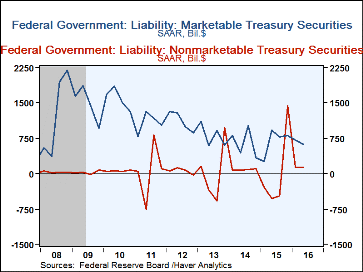
In Q2, the federal government borrowed $722 billion SAAR, down from Q1's $852 billion. Issuance of marketable Treasury securities was $629 billion in Q2 versus $719 billion the quarter before. Nonmarketable borrowing was $141 billion after $134 billion in Q1. Thus, the outsized debt-crisis volume of Q4-2015, $2,243 billion, is clearly seen as a special case.
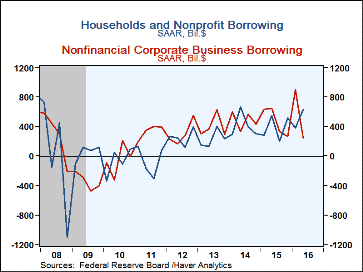
Households borrowed $622 billion SAAR in Q2, up from $372 billion in Q1. Net new home mortgages came to $241 billion, compared to $192 billion in Q1. The Q2 amount was the largest since Q1-2008, but still substantially smaller than during the housing boom just ahead of the recession. Consumer credit expanded $230 billion in Q2, slightly larger than the $199 billion in Q1. Credit card debt rose $69 billion, up from $49 billion, and student loans rose $86 billion, down from $96 billion. Over the last five years, student loan borrowing has averaged right at $91 billion each quarter. Borrowing by non-profits, hedge funds and others assigned to the "household" sector was $151 billion SAAR in Q2, versus a net paydown of $11 billion in Q1. Household borrowing was 4.5% of disposable personal income in Q2, up from 2.8% in Q1 and similar to the last three years; in sharp contrast, from 2003 through 2006, this ratio was just over 12%.
Nonfinancial corporate business borrowing diminished markedly in Q2 to $244 billion SAAR from $902 billion in Q1. Corporate bond issuance was $293 billion SAAR, down from Q1's $530 billion. Depository institution loans increased only $27 billion in Q2 after $156 billion in Q1, while loans from other lenders were paid down at a $165 billion annual rate, after increasing $138 billion in Q1. Commercial paper issuance was $12 billion in Q2, following $34 billion in Q1.
The financial sector borrowing appeared to firm up, with $571 billion in Q2, after $586 in Q1, the two strongest quarters since mid-2008. These latest periods were, however, far less than in the run-up to the recession and the financial crisis that characterized that period.
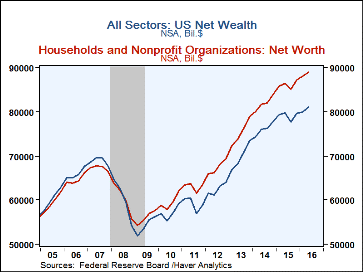
Press reports of these Financial Accounts highlight household balance sheets and net worth, and describe that amount at end-Q2 as a "record." Indeed, household net worth did rise in Q2 from a record amount in Q1, but the increase was marginal, to $89.1 trillion (level, not seasonally adjusted) from $88.0 trillion at the end of Q1. Homeowners' equity was $12.7 trillion, up from $12.4 trillion. Holdings of corporate equities at end-Q2 were $14.5 trillion, up from $14.2 trillion, and mutual fund holds were $6.7 trillion, slightly more than Q1's $6.5 trillion.
Net wealth of the total economy moved ahead $1.2 trillion in Q2 to $81.1 trillion from $79.9 trillion at end-Q1 (also levels, not seasonally adjusted). The total market value of domestic corporations rose to $29.4 trillion from $28.8 trillion; it had fallen during Q1 from $28.9 trillion at end-2015. Net financial claims on the "rest of the world" decreased from $-5.7 trillion at end-Q1 to -$5.8 trillion in Q2. The remainder of the net wealth measure consists of nonfinancial assets held by households, noncorporate business and governments; these totaled $57.5 trillion at end-Q2, up $810 billion from end-Q1.
The Financial Accounts data are in Haver's FFUNDS database. Associated information is compiled in the Integrated Macroeconomic Accounts produced jointly with the Bureau of Economic Analysis (BEA); these are carried in Haver's USNA database.
Carol Stone, CBE
AuthorMore in Author Profile »Carol Stone, CBE came to Haver Analytics in 2003 following more than 35 years as a financial market economist at major Wall Street financial institutions, most especially Merrill Lynch and Nomura Securities. She had broad experience in analysis and forecasting of flow-of-funds accounts, the federal budget and Federal Reserve operations. At Nomura Securities, among other duties, she developed various indicator forecasting tools and edited a daily global publication produced in London and New York for readers in Tokyo. At Haver Analytics, Carol was a member of the Research Department, aiding database managers with research and documentation efforts, as well as posting commentary on select economic reports. In addition, she conducted Ways-of-the-World, a blog on economic issues for an Episcopal-Church-affiliated website, The Geranium Farm. During her career, Carol served as an officer of the Money Marketeers and the Downtown Economists Club. She had a PhD from NYU's Stern School of Business. She lived in Brooklyn, New York, and had a weekend home on Long Island.
More Economy in Brief
 Global| Feb 05 2026
Charts of the Week: Balanced Policy, Resilient Data and AI Narratives
by:Andrew Cates


