 Global| Jun 11 2020
U.S. Financial Accounts Show Borrowing Dramatically Higher in Q1
Summary
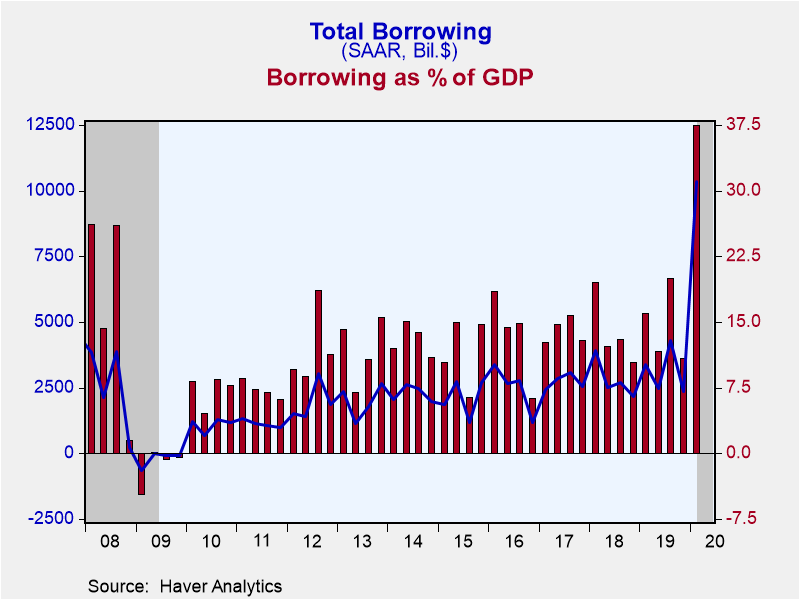
Total borrowing in U.S. financial markets ballooned to $10.346 trillion in Q1, a record amount and by far a record share of GDP, 48.0%, according to the Federal Reserve's Financial Accounts data. Q4 2019 saw total borrowing of $2.362 [...]
Total borrowing in U.S. financial markets ballooned to $10.346 trillion in Q1, a record amount and by far a record share of GDP, 48.0%, according to the Federal Reserve's Financial Accounts data. Q4 2019 saw total borrowing of $2.362 trillion, 10.9% of GDP and Q3 was $4.305 trillion, 20.0% of GDP The previous record amount was "just" $5.289 trillion in Q3 2007 in the run-up to what was becoming the Great Recession, equal to 36.4% of GDP. Note that all the dollar figures quoted here are seasonally adjusted annual rates.
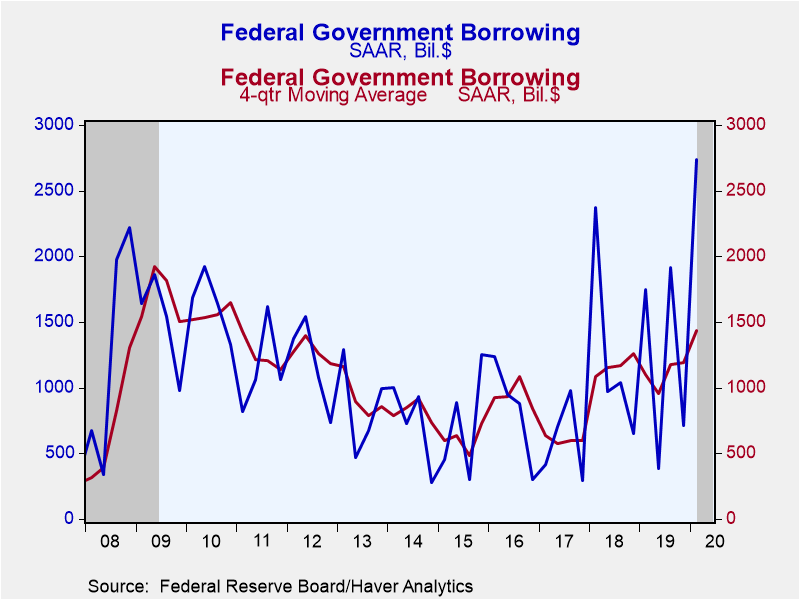
The sectors of the economy with the outsized borrowing in Q1 were the federal government and nonfinancial corporate business and financial institutions, each larger by multiples than previous recent periods. The federal government borrowed $2.734 trillion in Q1, covering the budget deficit, an increase in its cash balance and other items. Often when the budget deficit is larger, the cash balance has gone down, as one might presume, but this time it had a fairly sizable increase.
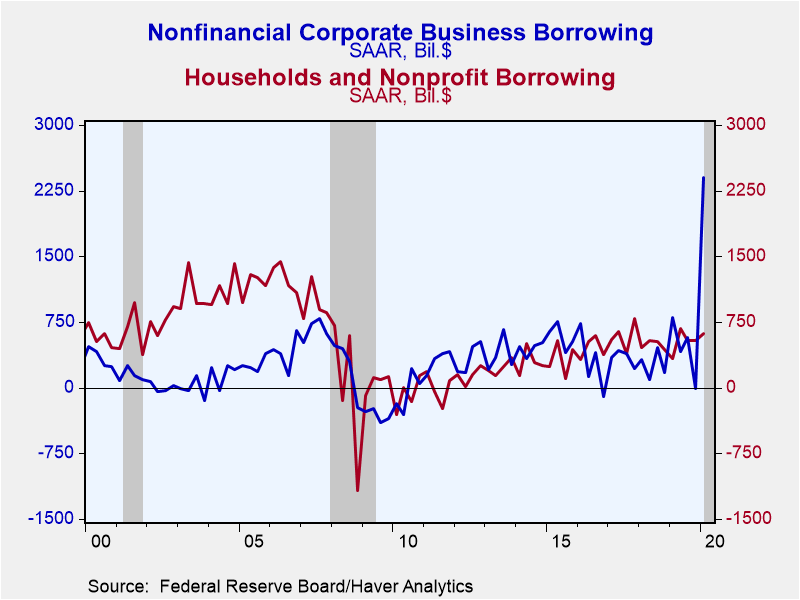
Nonfinancial corporate business had actually paid down debt by a miniscule $8 billion in Q4, but then borrowed $2.401 trillion in Q1. The majority of this record amount was bank loans, at an annual rate of $1.290 trillion; the next largest amount of bank borrowing had been $218 billion in Q3 2011. "Other loans and advances" rose at a $364 billion annual rate in Q4; its next-largest amount was $362 billion in Q3 2007. Net corporate bond issuance was $682 billion, also a record, with $634 billion in Q2 2015. We usually compare corporations' borrowing to their capital expenditure and over the five years ending in Q4 2019, that averaged 19.6%. But in Q1, they borrowed 121.4% of their capital expenditures. So there was evidently some other concern driving corporate financial behavior then.
Financial institutions borrowed $3.862 trillion in Q1, compared to $208 billion in Q4 and the previous record of $2.605 trillion in Q3 2007. The recent quarter marks 17.934% of GDP and virtually equal to that previous record of 17.921% in Q3 2007.
Households, by contrast, borrowed moderately in Q1, $622 billion or 3.7% of disposable personal income. The average over the last five years is 3.2%, so the latest period is very similar, suggesting no special factor is involved. Mortgages on 1-4 family homes were $340 billion, up from $251 billion in Q4. Consumer credit borrowing was actually quite modest at $66 billion in Q1, down from $171 billion in Q4; within consumer credit, student loans and auto loans grew more slowly and people actually paid down credit card debt at an $83 billion annual rate.
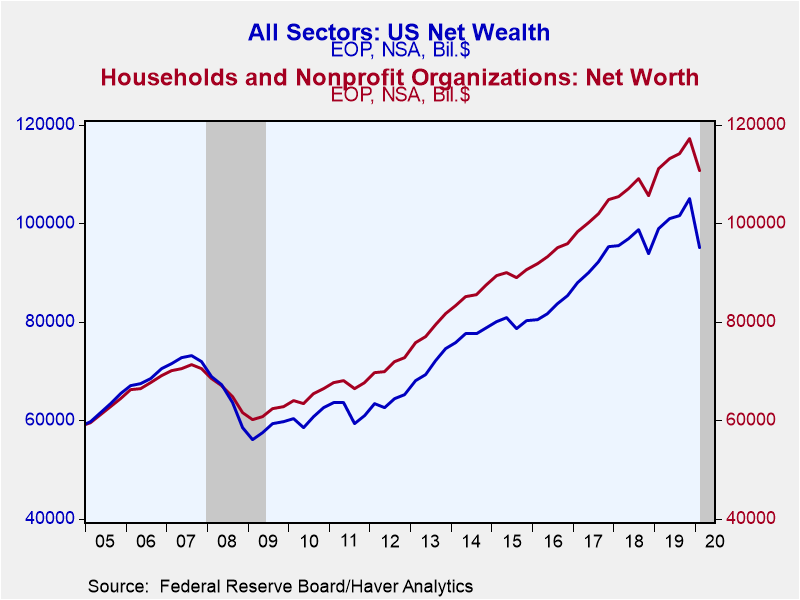
Net wealth of the total U.S. economy, not surprisingly, dropped in Q1; on March 31 it was $95.169 trillion, compared to $105.082 trillion on December 31. The change, -$9.913 trillion (actual quarterly amount, not annualized or seasonally adjusted), almost exactly equaled the change in the market valuation of corporate businesses, -$9.908 trillion. The value of nonfinancial assets held by domestic sectors of the U.S. economy at the end of Q1 was $71.263 trillion, up $710 billion from the end of Q4, and net financial claims on the rest of the world were -$11.296 trillion on December 31, slightly more negative than the -$10.581 trillion on December 31.
Households' net worth on March 31 was $110.788 trillion, down from $117.335 trillion at year-end 2019; besides stock market holdings of $23.851 trillion (including both direct holdings and mutual fund shares), households owned $30.316 trillion in real estate, which would be partially offset by $10.659 trillion in home mortgages.
The Financial Accounts data are in Haver's FFUNDS database. Associated information is compiled in the Integrated Macroeconomic Accounts produced jointly with the Bureau of Economic Analysis (BEA); these are carried in Haver's USNA database as well as in FFUNDS.| Financial Accounts (SAAR, Bil.$) | Q1'20 | Q4'19 | Q3'19 | 2019 | 2018 | 2017 | 2016 |
|---|---|---|---|---|---|---|---|
| Total Borrowing* | 10,346 | 2,362 | 4,305 | 3,078 | 2,822 | 2,709 | 2,523 |
| % of GDP | 48.0 | 10.9 | 20.0 | 14.6 | 13.7 | 14.0 | 13.4 |
| Federal Government | 2,734 | 712 | 1,919 | 1,191 | 1,258 | 599 | 843 |
| Households | 622 | 544 | 543 | 548 | 487 | 579 | 460 |
| Nonfinancial Corporate Business | 2,401 | -8.5 | 568 | 458 | 277 | 544 | 292 |
| Financial Sectors | 3,862 | 208 | 495 | 390 | 346 | 325 | 468 |
| Foreign Sector | 106 | 442 | 436 | 202 | 178 | 402 | 38 |
*Previously called "credit market borrowing" and includes debt securities plus loans. The total here includes borrowing by noncorporate business and state & local governments, not shown separately.
Carol Stone, CBE
AuthorMore in Author Profile »Carol Stone, CBE came to Haver Analytics in 2003 following more than 35 years as a financial market economist at major Wall Street financial institutions, most especially Merrill Lynch and Nomura Securities. She has broad experience in analysis and forecasting of flow-of-funds accounts, the federal budget and Federal Reserve operations. At Nomura Securites, among other duties, she developed various indicator forecasting tools and edited a daily global publication produced in London and New York for readers in Tokyo. At Haver Analytics, Carol is a member of the Research Department, aiding database managers with research and documentation efforts, as well as posting commentary on select economic reports. In addition, she conducts Ways-of-the-World, a blog on economic issues for an Episcopal-Church-affiliated website, The Geranium Farm. During her career, Carol served as an officer of the Money Marketeers and the Downtown Economists Club. She has a PhD from NYU's Stern School of Business. She lives in Brooklyn, New York, and has a weekend home on Long Island.


