 Global| Sep 23 2019
U.S. Financial Accounts Show Continuing Moderation in Borrowing
Summary
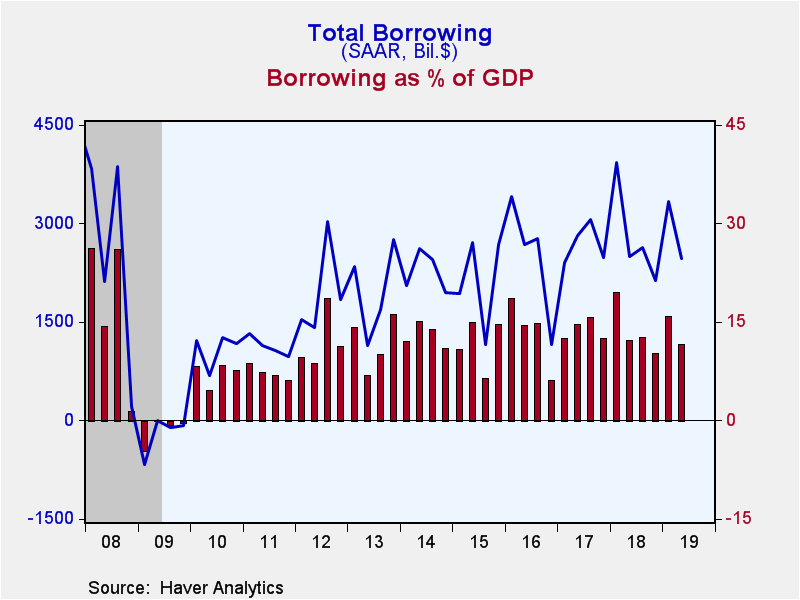
Total borrowing in U.S. financial markets was $2,463 billion in Q2 2019, down from $3,328 billion in Q1, according to the Federal Reserve's Financial Accounts data, which were released September 20. This Q2 amount represented 11.5% of [...]
Total borrowing in U.S. financial markets was $2,463 billion in Q2 2019, down from $3,328 billion in Q1, according to the Federal Reserve's Financial Accounts data, which were released September 20. This Q2 amount represented 11.5% of GDP in Q2, compared to 15.8% of GDP in Q1. The 11.5% also compares to a ten-year average of 11.3%, so seems well within a comfortable range. We wondered last quarter if a stronger borrowing trend might develop, but this was not the case. Note that all the numbers quoted here are seasonally adjusted annual rates.
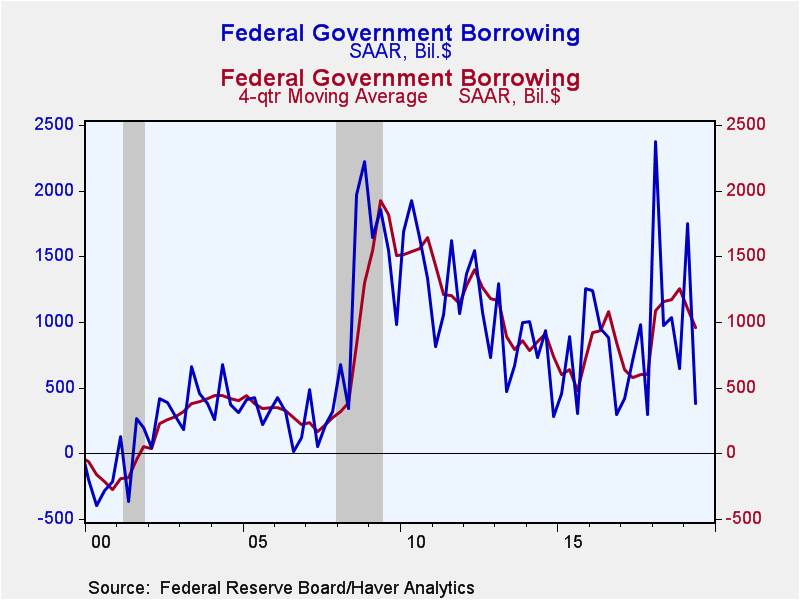
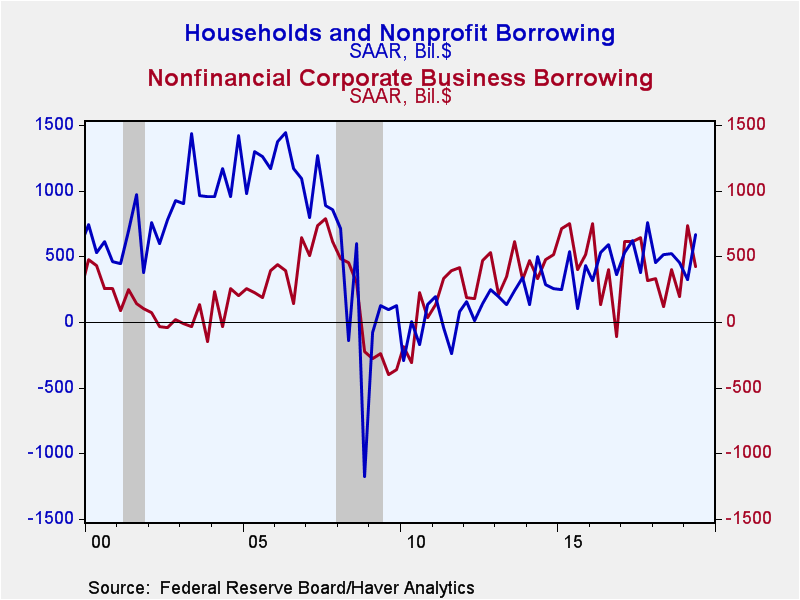
Borrowing by major sectors of the U.S. economy was somewhat mixed in Q2. Federal government borrowing -- again on a seasonally adjusted annual rate basis -- decreased to $382 billion from $1,751 billion in Q1. Household borrowing increased to $668 billion from $323 billion and foreign sector was $401 billion after a net paydown of $64 billion.
After growing noticeably in Q1 by $733 billion, nonfinancial corporate business borrowing slowed in Q2 to $421 billion, although that was hardly weak. Companies issued $294 billion, net, in new bonds after $337 billion in Q1. They borrowed $173 billion in new loans, down moderately from $271 billion In Q1, and they paid down $42 billion in commercial paper after issuing $107 billion in Q1. The overall increase in corporate debt represented 19.6% of capital outlays in Q2; that's down from a ratio of 33.5% in Q1 and very slightly higher than a 10-year average of 18.6%. In another comparison, borrowing represented 44% of after-tax corporate profits in Q2, and that ratio compares to a post-Great-Recession average of 40%. So it seems not to be excessive, at least through the middle of 2019.
Financial institutions borrowed $408 billion in Q2, up from $331 in Q1. This represents 1.9% of GDP and remains close in line with the magnitude of those institutions' funding needs over the last five or six years. This recent trend is substantially less than in the run-up to the Great Recession, when the ratio was often greater than 10%.
Regarding households, the increase in Q2 borrowing took place in both consumer credit and home mortgages. Consumer credit grew by $188 billion in Q2, up slightly from $171 billion in Q1. Credit card debt and student loans both increased more in Q2, while auto loans and "other" grew by less then than in Q1. Home mortgages grew by $330 billion in Q2, up from $226 billion in Q1. The total of household borrowing equaled 4.1% of disposable personal income. While this was double the 2% ratio in Q1, it compares to more than 12% in 2005 and 2006, just ahead of the Great Recession.
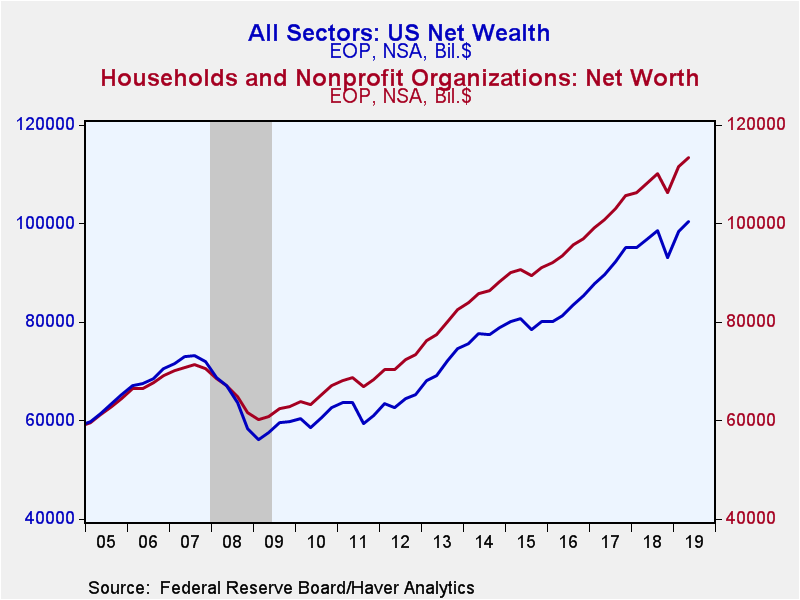
The Fed's press release of these Financial Accounts and the associated press reports highlight household balance sheets and net worth. Household net worth continued to grow in Q2, especially as the stock market remained on an uptrend. Net worth was $113.5 trillion on June 30 (amount outstanding, not seasonally adjusted), compared to $111.6 trillion on March 31. The Q2 amount was 692% of disposable personal income, up marginally from 689% in Q1. In Q2, households' holdings of corporate equities and mutual fund shares rose by $821 billion (not seasonally adjusted quarterly change) after gaining $3.038 trillion in Q1, while holdings of debt securities and money fund shares increased $262 billion, up somewhat from $162 billion in Q1. Real estate holdings and other nonfinancial assets increased $325 billion in Q2 after $790 billion in Q1. Household liabilities rose $175 billion following a mere $6 billion in Q1. Home mortgage liabilities were $10.415 trillion on June 30, which represents 35.8% of household real estate holdings, almost exactly the same share at the end of the quarter before. The Q1 and Q2 ratios are the smallest fraction since Q1 1991 and contrast with 53%-54% from 2009 through early 2012, during and in the aftermath of the Great Recession financial crisis.
Net wealth of the total U.S. economy increased $1.986 trillion in Q2, less than the $5.219 trillion of Q1, when the stock market rebounded after its late-2018 drop. The net wealth total on June 30 was $100.4 trillion, compared to $98.4 trillion on March 31 (levels, not seasonally adjusted). The associated market value of domestic corporations rose $1.406 trillion in Q2, again less than the stock-market-driven bounce of $4.492 billion the previous quarter. Net financial claims on the "rest of the world" were -$9.572 trillion on June 30, a bit larger than the -$9.289 trillion deficit on March 31. The remainder of the net wealth measure consists of nonfinancial assets held by households, noncorporate business and governments; these totaled $69.073 trillion on June 30, up $863 billion from March 31.
The Financial Accounts data are in Haver's FFUNDS database. Associated information is compiled in the Integrated Macroeconomic Accounts produced jointly with the Bureau of Economic Analysis (BEA); these are carried in Haver's USNA database as well as in FFUNDS.
| Financial Accounts (SAAR, Bil.$) | Q2'19 | Q1'19 | Q4'18 | 2018 | 2017 | 2016 | 2015 |
|---|---|---|---|---|---|---|---|
| Total Borrowing* | 2463 | 3328 | 2135 | 2797 | 2693 | 2511 | 2124 |
| Federal Government | 382 | 1751 | 648 | 1258 | 599 | 843 | 725 |
| Households | 668 | 323 | 451 | 484 | 570 | 449 | 329 |
| Nonfinancial Corporate Business | 421 | 733 | 196 | 262 | 545 | 292 | 592 |
| Financial Sectors | 408 | 331 | 462 | 346 | 325 | 468 | 185 |
| Foreign Sector | 401 | -64 | -64 | 177 | 398 | 38 | 32 |
Carol Stone, CBE
AuthorMore in Author Profile »Carol Stone, CBE came to Haver Analytics in 2003 following more than 35 years as a financial market economist at major Wall Street financial institutions, most especially Merrill Lynch and Nomura Securities. She has broad experience in analysis and forecasting of flow-of-funds accounts, the federal budget and Federal Reserve operations. At Nomura Securites, among other duties, she developed various indicator forecasting tools and edited a daily global publication produced in London and New York for readers in Tokyo. At Haver Analytics, Carol is a member of the Research Department, aiding database managers with research and documentation efforts, as well as posting commentary on select economic reports. In addition, she conducts Ways-of-the-World, a blog on economic issues for an Episcopal-Church-affiliated website, The Geranium Farm. During her career, Carol served as an officer of the Money Marketeers and the Downtown Economists Club. She has a PhD from NYU's Stern School of Business. She lives in Brooklyn, New York, and has a weekend home on Long Island.


