 Global| Jun 11 2021
U.S. Financial Accounts Show Credit Demand at 24.5% of GDP in Q1
Summary
• Federal government borrows $1.543 trillion, seasonally adjusted annual rate. • Households also borrow more than $1 trillion. Borrowing in U.S. financial markets and institutions was sizable in Q1 2021, but was similar in absolute [...]
• Federal government borrows $1.543 trillion, seasonally adjusted annual rate.
• Households also borrow more than $1 trillion.
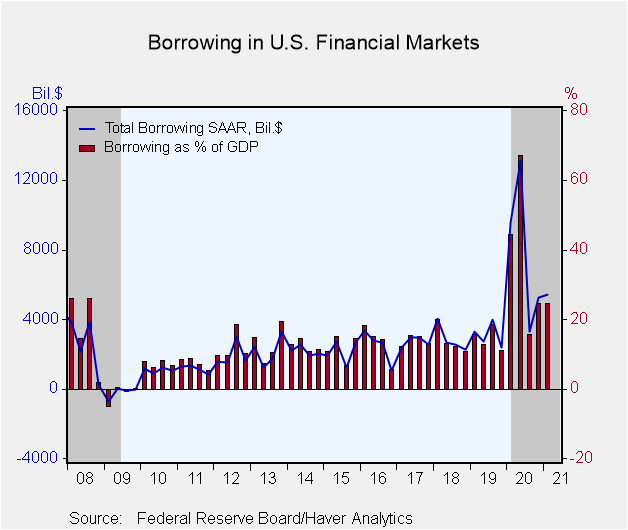
Borrowing in U.S. financial markets and institutions was sizable in Q1 2021, but was similar in absolute size and relative to the size of the economy as it had been in Q4 2020. Consumers, businesses, governments and financial institutions together borrowed $5.414 trillion, equal to 24.5% of GDP, up slightly from $5.262 trillion in Q4, which was also 24.5% of GDP. In contrast, back in Q2 2020, during the pandemic "whipsaw," borrowing had been $13.1 trillion, equal to 67.1% of GDP, due mostly to huge credit demand from the federal government as it began to distribute funds from the CARES Act and other pandemic-related support programs. These dollar amounts are seasonally adjusted annual rates.
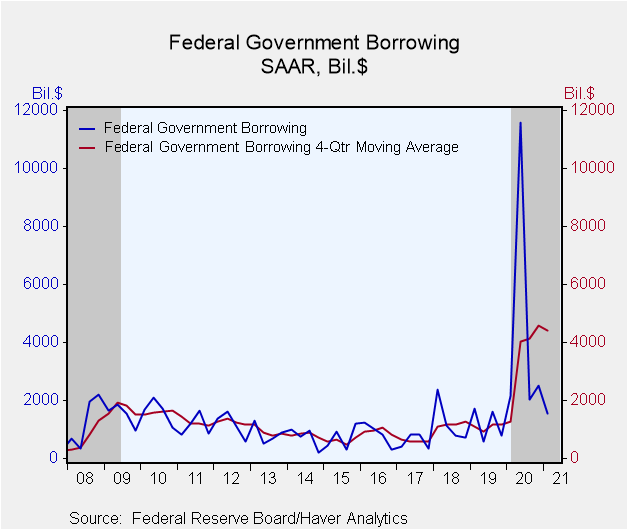
The federal government borrowed $1.543 trillion in Q1 at a seasonally adjusted annual rate. That was 7.0% of GDP, down from $2.513 trillion in Q4, equal to 11.7% of GDP.
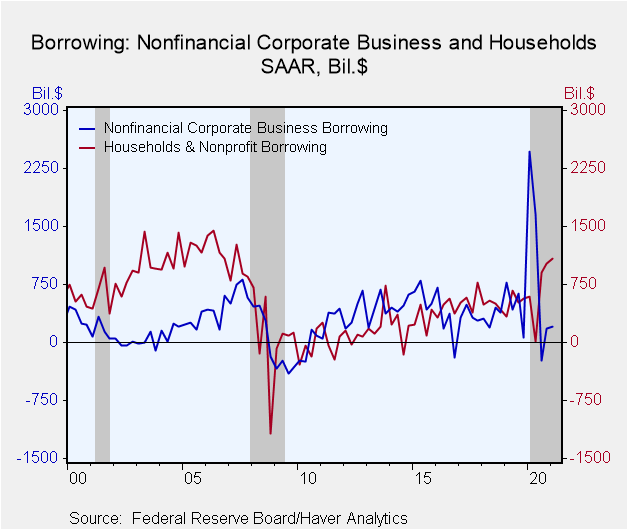
Households borrowed at an annual rate of $1.08 trillion in Q1, including $124 billion in consumer credit and $591 billion in 1-4 family home mortgages. This latter item reflects the current record-low mortgage rates, which are encouraging a strong home-buying market. The Q1 amount of $581 billion is the largest since Q3 2007, just before the onset of the Great Recession
Corporate businesses again had relatively modest financial dealings in Q1. They had participated in that "whipsaw" back in Q1 and Q2 of 2020, but in Q3 paid down just $240 billion in debt and then borrowed just $175 billion in Q4. Now, in the latest quarter, they again borrowed modestly, $201 billion.
Financial institutions again borrowed notably in Q1, $945 billion, which followed $$995 billion in Q4 2020. These represent 4.3% of GDP and 4.6%, respectively. These are the largest back-to-back proportions since before the Great Recession. This sector's borrowing in that pre-Recession period was considerable stronger, approximately 10% of GDP.
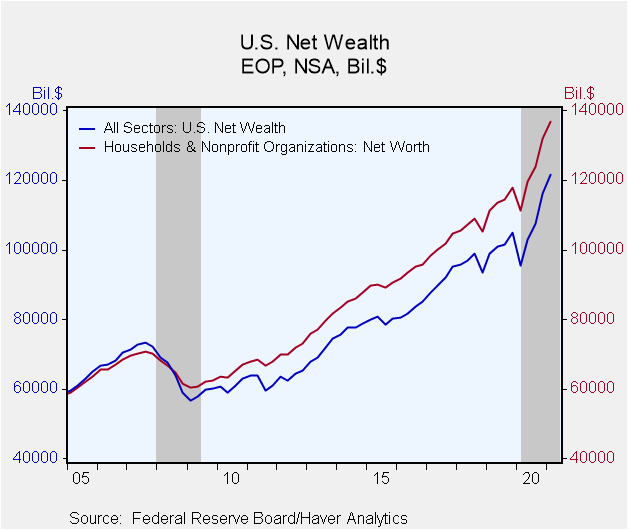
Net wealth in the total U.S. economy increased $5.506 trillion (quarterly rate, not annualized or seasonally adjusted) in Q1, following an increase of $8.598 trillion in Q4. The vast majority of the Q1 gain was again the increase in equity values, $4.318 trillion. Household net worth on March 31 was $136.9 trillion, up $4.997 trillion from December 31,
The Financial Accounts data are in Haver's FFUNDS database. Associated information is compiled in the Integrated Macroeconomic Accounts produced jointly with the Bureau of Economic Analysis (BEA); these are carried in Haver's USNA database as well as in FFUNDS.
| Financial Accounts (SAAR, Bil.$) | Q1'21 | Q4'20 | Q3'20 | Q2'20 | 2020 | 2019 | 2018 |
|---|---|---|---|---|---|---|---|
| Total Borrowing* | 5,414 | 5,262 | 3,315 | 13,099 | 7,813 | 3,080 | 2,869 |
| % of GDP | 24.5 | 24.5 | 15.7 | 67.1 | 37.3 | 14.4 | 13.9 |
| Federal Government | 1,543 | 2,513 | 2,045 | 11,598 | 4,581 | 1,175 | 1,258 |
| Households | 1,079 | 1,023 | 902 | 10 | 631 | 521 | 489 |
| Nonfinancial Corporate Business | 201 | 175 | -240 | 1,650 | 1,013 | 474 | 333 |
| Financial Sectors | 945 | 995 | -106 | -1,397 | 894 | 374 | 349 |
| Foreign Sector | 948 | 491 | 186 | 205 | 124 | 253 | 198 |
*Previously called "credit market borrowing" and includes debt securities plus loans. The total here includes borrowing by noncorporate business and state & local governments, not shown separately.
Carol Stone, CBE
AuthorMore in Author Profile »Carol Stone, CBE came to Haver Analytics in 2003 following more than 35 years as a financial market economist at major Wall Street financial institutions, most especially Merrill Lynch and Nomura Securities. She has broad experience in analysis and forecasting of flow-of-funds accounts, the federal budget and Federal Reserve operations. At Nomura Securites, among other duties, she developed various indicator forecasting tools and edited a daily global publication produced in London and New York for readers in Tokyo. At Haver Analytics, Carol is a member of the Research Department, aiding database managers with research and documentation efforts, as well as posting commentary on select economic reports. In addition, she conducts Ways-of-the-World, a blog on economic issues for an Episcopal-Church-affiliated website, The Geranium Farm. During her career, Carol served as an officer of the Money Marketeers and the Downtown Economists Club. She has a PhD from NYU's Stern School of Business. She lives in Brooklyn, New York, and has a weekend home on Long Island.


