 Global| Mar 06 2014
U.S. Financial Accounts Show Larger Total Credit Demand, But Households and Corporations Use Less
Summary
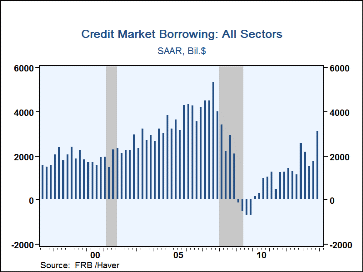
The Federal Reserve's financial accounts data (formerly known as the "flow of funds") for Q4 show total credit market borrowing at a $3.12 trillion annual rate, compared with $1.75 trillion in Q3 and the largest amount since Q1 2008. [...]
 The Federal Reserve's financial accounts data (formerly known as the "flow of
funds") for Q4 show total credit market borrowing at a $3.12
trillion annual rate, compared with $1.75 trillion in Q3 and the largest amount
since Q1 2008. Q3 is mildly revised from $1.57 trillion reported in December. The Q4 amount
represents 18.2% of GDP, compared to 10.3% in Q3 and actually running with the 20-year average
that has ranged around 17-18%. There are, however, suggestions of
transitory patterns that may not imply a resumption of historical credit
demands; in particular, as we will see, the main private domestic borrowers,
households and corporations, used less credit in Q4.
For 2013 as a whole, borrowing came to $2.14 trillion, 12.7% of GDP, up from $1.61 billion in 2012, representing 9.9% of GDP.
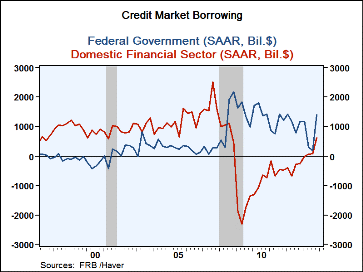
A sizable portion of the pick-up in Q4 borrowing came from the federal government, which used $1.39 trillion, far more than the modest $174 billion in Q3. The year 2013 came to $759 billion, large historically, but the smallest since 2007, before the recession. All these figures are quoted at seasonally adjusted annual rates.
The other sector in which borrowing increased in Q4 was financial institutions. These firms in total borrowed $612 billion, up from a mere $78 billion in Q3. Borrowing by government-sponsored enterprises, consisting mainly of Fannie Mae and Freddie Mac, picked up to $206 billion, their largest since Q2 2008, but otherwise smaller than their pre-recession amounts. Bank and saving association holding companies were the other sizable borrowers in Q4, with a total of $207 billion; historical data show a very erratic pattern of credit usage by these holding companies, which are the parents companies of depository institutions and not those institutions themselves.
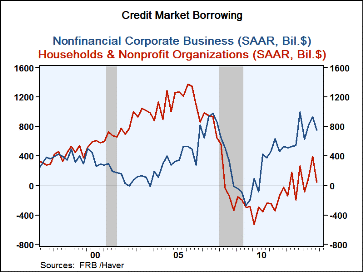
In contrast, the main domestic nongovernmental, nonfinancial sectors did less borrowing in Q4. Households used just $49 billion, down from $393 billion in Q3. They returned to liquidating home mortgages, by $93 billion, after net borrowing of mortgage funds in Q3 of $89 billion, which has been the only positive quarter since Q1 2009. Consumer credit demand decreased modestly to $166 billion from $179 billion in Q3. Within the consumer credit category, auto loans slowed to a $36 billion pace in Q4 from $102 billion, and student loans also slowed, to $52 billion from $137 billion; this extends a long-standing sawtooth quarterly pattern. Credit card debt increased $16 billion, and "other" consumer credit rose $64 billion, reversing the prior period's liquidation. Other types of depository institution loans to the household sector had a net liquidation of $15 billion in Q4, following net borrowing of $130 billion in Q3.
Nonfinancial corporations' borrowing was $759 billion in Q4, down from $928 billion in Q3. As recently most often the case in this sector, bonds were by far the largest form of borrowing, providing $666 billion in Q4, although this was less than Q3's $745 billion. Borrowing from depository institutions in Q4 was negligible at just $3 billion, while corporations liquidated $43 billion of commercial paper liabilities.
The Financial Accounts data are in Haver's FFUNDS database. Associated information is compiled in the Integrated Macroeconomic Accounts produced jointly with the Bureau of Economic Analysis (BEA); these are carried in Haver's USNA database.
Carol Stone, CBE
AuthorMore in Author Profile »Carol Stone, CBE came to Haver Analytics in 2003 following more than 35 years as a financial market economist at major Wall Street financial institutions, most especially Merrill Lynch and Nomura Securities. She has broad experience in analysis and forecasting of flow-of-funds accounts, the federal budget and Federal Reserve operations. At Nomura Securites, among other duties, she developed various indicator forecasting tools and edited a daily global publication produced in London and New York for readers in Tokyo. At Haver Analytics, Carol is a member of the Research Department, aiding database managers with research and documentation efforts, as well as posting commentary on select economic reports. In addition, she conducts Ways-of-the-World, a blog on economic issues for an Episcopal-Church-affiliated website, The Geranium Farm. During her career, Carol served as an officer of the Money Marketeers and the Downtown Economists Club. She has a PhD from NYU's Stern School of Business. She lives in Brooklyn, New York, and has a weekend home on Long Island.


