 Global| Mar 08 2019
U.S. Financial Accounts Show Less Borrowing in Q4
Summary
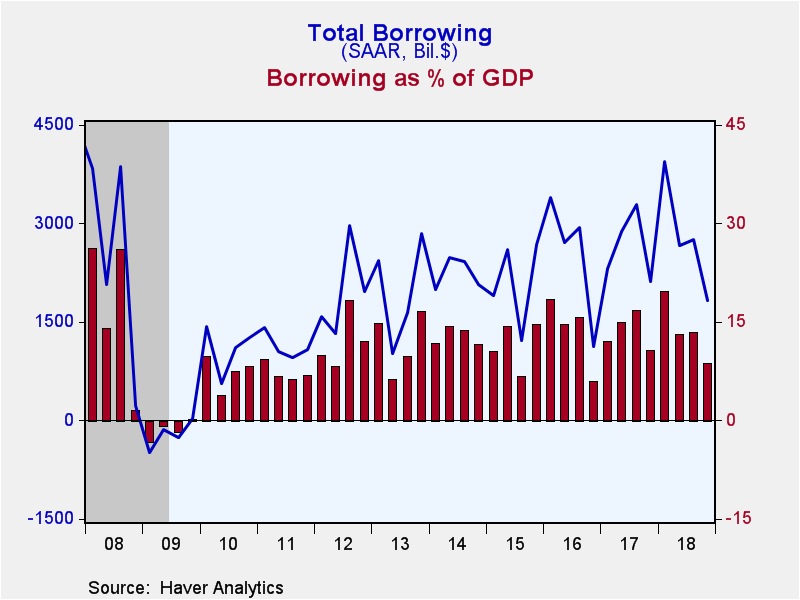
Total borrowing in U.S. financial markets decreased in Q4 2018, according to the Federal Reserve's Financial Accounts data, which were published Thursday, March 7. It totaled $1,826 billion at a seasonally adjusted annual rate, [...]
Total borrowing in U.S. financial markets decreased in Q4 2018, according to the Federal Reserve's Financial Accounts data, which were published Thursday, March 7. It totaled $1,826 billion at a seasonally adjusted annual rate, compared to $2,756 billion in Q3. The reduction took place in several nonfinancial sectors of the economy, mainly the federal government. We’ll detail these a bit more below. In Q4, borrowing by nonfinancial and financial sectors together, represented just 8.7% of GDP, the smallest ratio since Q4 2016. For 2018 as a whole, borrowing totaled $2,798 billion, up modestly from $2,650 billion in 2017; the 2018 amount was 13.6% of GDP, the same ratio as in the previous two years. For comparison, just before the Great Recession, borrowing exceeded 30% of GDP and during that recession, there was a slight net paydown of debt for the year 2009, so the ratio was negative.
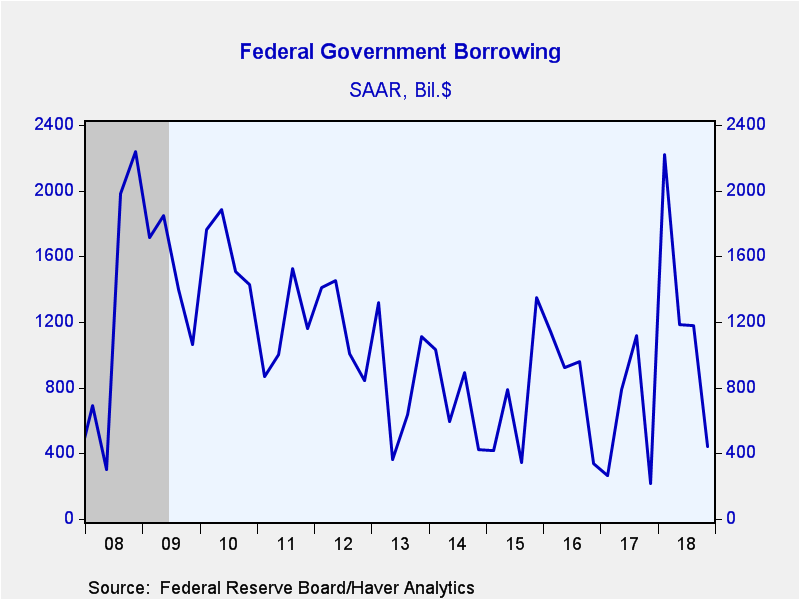
In Q4, borrowing by the federal government was only $444 billion, again at a seasonally adjusted annual rate, down from $1,180 billion in Q3. Even with the Q4 slowdown, borrowing had been so large early in the year that the total for all of 2018 reached $1,410 billion, the largest yearly total since 2010.
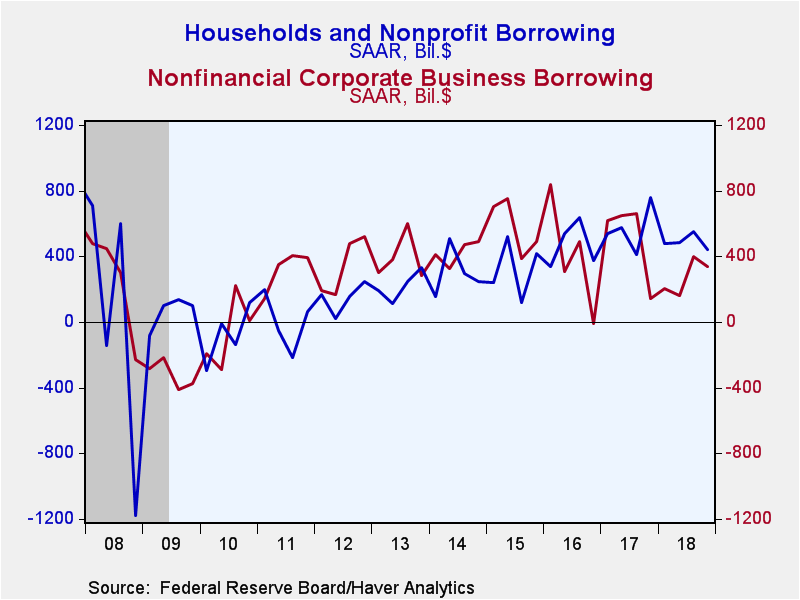
Households, by coincidence, also borrowed $444 billion, SAAR, in Q4, somewhat less than the $551 billion in their new debt in Q3. The Q4 amount is 2.8% of disposable personal income and remained close to the five-year average of 3.0%. As we've pointed out before, this is far lower than the 10%-12% range that prevailed ahead of the Great Recession. Home mortgages grew $216 billion in Q4, down from $319 billion in Q3 and the smallest amount since $153 billion in Q1 2016. Consumer credit, in contrast, picked up a bit, growing $244 billion, SAAR, from $233 billion in Q3. Credit cards, auto loans and student loans all had modest increases over Q3 amounts while “other” consumer credit use was much smaller after a surge in Q3.
Nonfinancial corporations borrowed $335 billion, SAAR, in Q4, slightly less than the $397 billion in Q3. The Q4 amount included $76 billion in corporate bonds and $362 billion in depository institution loans. Companies paid down $104 billion in commercial paper and $70 billion in “other” loans. This borrowing covered just 15% of capital outlays in Q4 and 12.8% for all of 2018, compared to roundly 24% during the 2011-2017 years.
Financial institutions' borrowings picked up in Q4, totaling $423 billion, SAAR, following $271 billion in Q3. For all of 2018, they borrowed $366 billion, representing just 1.8% of GDP. That’s in line with recent years, but as with other sectors, a mere fraction of the magnitude of borrowing before the Great Recession – 8%-10% of GDP with 14.3% in 2007.
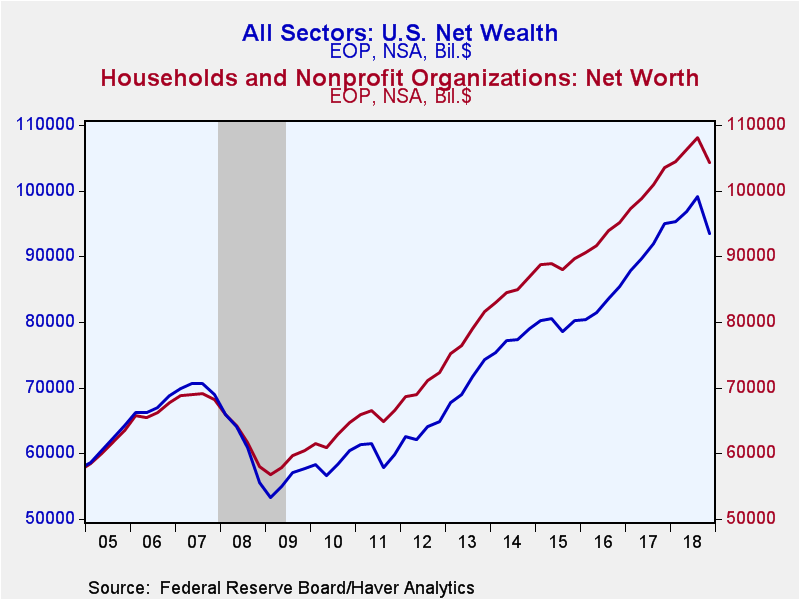
Press reports of these Financial Accounts highlight household balance sheets and net worth. Household net worth fell markedly, mostly reflecting the drop in the stock market. Net worth was $104.3 trillion at year-end (amount outstanding, not seasonally adjusted), down from $108.1 trillion on September 30. The Q4 amount was 660% of disposable personal income, down from 693% at the end of Q3. In Q4, households' holdings of corporate equities and mutual fund shares shrank by $3.883 trillion (not seasonally adjusted quarterly change), while holdings of debt securities and money fund shares increased $370 billion. Real estate holdings and other nonfinancial assets gained $345 billion. Household liabilities increased just $133 billion. Home mortgage liabilities were $10.337 trillion, which represents 39.9% of real estate holdings; as was the case for Q3, the Q4 number is again the lowest ratio since mid-2002 and contrasts with 63.3% in Q1 2009 in the midst of the Great Recession financial crisis.
Net wealth of the total U.S. economy dropped $5.742 trillion in Q4 after a $2.261 trillion increase in Q3. It amounted to $93.4 trillion at year-end, down from $99.2 billion on September 30 (levels, not seasonally adjusted). This again reflected the decline in the stock market, as the total market value of domestic corporations fell $6.446 trillion in Q4 after a $2.155 trillion increase in Q3. Net financial claims on the "rest of the world" were -$6.218 trillion at year-end, actually a bit smaller than the -$6.300 trillion deficit on September 30. The remainder of the net wealth measure consists of nonfinancial assets held by households, noncorporate business and governments; these totaled $64.659 trillion on December 31, up $622 billion from September 30.
The Financial Accounts data are in Haver's FFUNDS database. Associated information is compiled in the Integrated Macroeconomic Accounts produced jointly with the Bureau of Economic Analysis (BEA); these are carried in Haver's USNA database as well as in FFUNDS.
Carol Stone, CBE
AuthorMore in Author Profile »Carol Stone, CBE came to Haver Analytics in 2003 following more than 35 years as a financial market economist at major Wall Street financial institutions, most especially Merrill Lynch and Nomura Securities. She has broad experience in analysis and forecasting of flow-of-funds accounts, the federal budget and Federal Reserve operations. At Nomura Securites, among other duties, she developed various indicator forecasting tools and edited a daily global publication produced in London and New York for readers in Tokyo. At Haver Analytics, Carol is a member of the Research Department, aiding database managers with research and documentation efforts, as well as posting commentary on select economic reports. In addition, she conducts Ways-of-the-World, a blog on economic issues for an Episcopal-Church-affiliated website, The Geranium Farm. During her career, Carol served as an officer of the Money Marketeers and the Downtown Economists Club. She has a PhD from NYU's Stern School of Business. She lives in Brooklyn, New York, and has a weekend home on Long Island.


