 Global| Jun 11 2015
U.S. Financial Accounts Show Markedly Reduced Credit Needs in Q1
Summary
Total credit market borrowing was sharply reduced in Q1, according to the Federal Reserve's Financial Accounts of the U.S., which were published today. Net paydowns by the federal government and the financial sector led to a reduction [...]
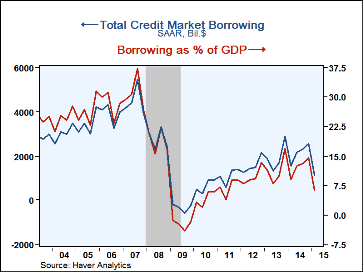
Total credit market borrowing was sharply reduced in Q1, according to the Federal Reserve's Financial Accounts of the U.S., which were published today. Net paydowns by the federal government and the financial sector led to a reduction in the seasonally adjusted total to $1.13 trillion from $2.57 trillion in Q4. That latter figure was slightly revised from $2.47 trillion initially reported. As we will explain, the key here is "seasonally adjusted," since the federal government in fact did borrow funds in Q1.
The Q1 total amount is 6.4% of GDP, following 14.5% in Q4. This is the smallest ratio since Q2 2011. This ratio peaked at 37.3% in Q3 2007, just at the peak of the previous business cycle, and there were total net paydowns during 2009, in the depth of the recession.
Many press reports of these Financial Accounts highlight the household balance sheet data and the results they show for net worth. This result did continue to improve in Q1, reaching $84.9 billion. This was 639% of disposable income, the highest such ratio since Q3 2007, before the financial crisis and recession. However, these Financial Accounts cover the entire economy, and here in our commentary, we emphasize portions describing broad borrowing aggregates. These had undergone a historically unprecedented contraction during the last recession. Most of the time recently, total borrowing has ratcheted upward both in total and as a ratio to GDP. So Q1's reduction and low GDP ratio might be construed as a bad sign.
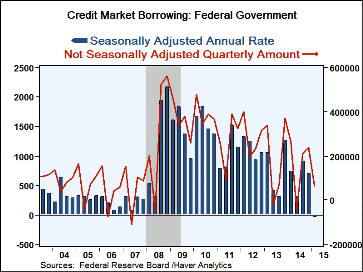
However, as we point out, the main source of the reduction among nonfinancial sectors is the federal government. It borrowed $66.8 billion during Q1, a period when its borrowing is generally much larger. Thus, after seasonal adjustment, this number translated into a net paydown of $13.4 billion, or $53.8 billion at an annual rate. Since the budget deficit has diminished, such a borrowing result, while startling, would logically follow. And it is probably not "a bad sign" about the economy's health, which is good enough to help the budget deficit shrink.
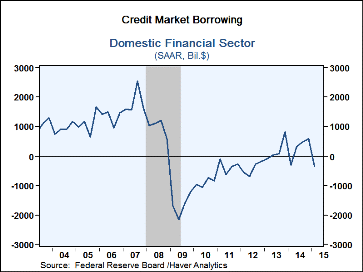
The other source of marked reduction in total borrowing came from two of the financial sectors, government-sponsored enterprises (GSEs) and depository institutions. GSEs paid down $164 billion in their direct debt, and their mortgage pools shrank by $851 million. While their direct debt has often diminished in recent years, this is apparently the first cut in the amount of mortgage pool securities. Depository institutions, i.e., banks and similar institutions, paid down $136 billion in debt, unusual by historical standards, but not so unusual since the recession. Among other financial sectors, broker-dealers, holding companies and asset-backed securities issuers all paid down marginal amounts.
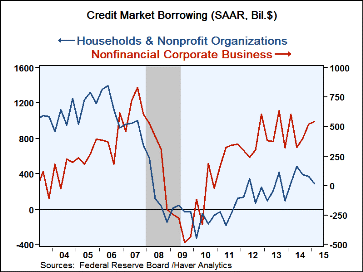
Among nonfinancial sectors, households borrowed $292 billion in Q1, less than 2014 amounts, but firmer than previous post-recession periods. Home mortgages returned to a modest net paydown after three quarters of net borrowing, while consumer credit ran upward at about its recent pace. Corporate business borrowed $542 billion, a similar magnitude to other recent periods, including, among other sources of funds, $450 billion in corporate bonds and $109 billion in depository institution loans.
The Financial Accounts data are in Haver's FFUNDS database. Associated information is compiled in the Integrated Macroeconomic Accounts produced jointly with the Bureau of Economic Analysis (BEA); these are carried in Haver's USNA database.
Carol Stone, CBE
AuthorMore in Author Profile »Carol Stone, CBE came to Haver Analytics in 2003 following more than 35 years as a financial market economist at major Wall Street financial institutions, most especially Merrill Lynch and Nomura Securities. She had broad experience in analysis and forecasting of flow-of-funds accounts, the federal budget and Federal Reserve operations. At Nomura Securities, among other duties, she developed various indicator forecasting tools and edited a daily global publication produced in London and New York for readers in Tokyo. At Haver Analytics, Carol was a member of the Research Department, aiding database managers with research and documentation efforts, as well as posting commentary on select economic reports. In addition, she conducted Ways-of-the-World, a blog on economic issues for an Episcopal-Church-affiliated website, The Geranium Farm. During her career, Carol served as an officer of the Money Marketeers and the Downtown Economists Club. She had a PhD from NYU's Stern School of Business. She lived in Brooklyn, New York, and had a weekend home on Long Island.
More Economy in Brief
 Global| Feb 05 2026
Charts of the Week: Balanced Policy, Resilient Data and AI Narratives
by:Andrew Cates


