 Global| Mar 08 2018
U.S. Financial Accounts Show Moderation in Borrowing
Summary
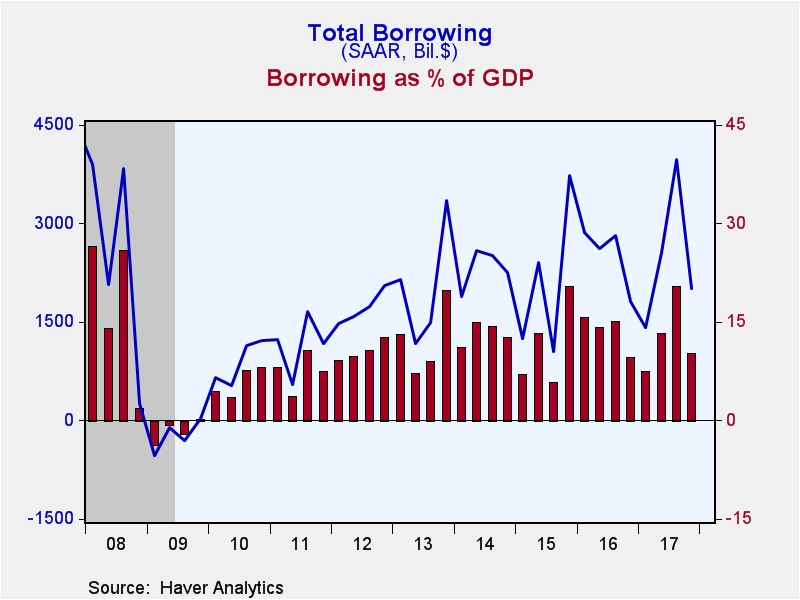
Borrowing in U.S. financial markets slowed in Q4 2017, according to the Federal Reserve's Financial Accounts data, which show debt issuance of $2,011 billion at a seasonally adjusted annual rate. This is just over half of the Q3 [...]
Borrowing in U.S. financial markets slowed in Q4 2017, according to the Federal Reserve's Financial Accounts data, which show debt issuance of $2,011 billion at a seasonally adjusted annual rate. This is just over half of the Q3 amount, $3,975 billion SAAR. For all of 2017, borrowing was $2,490 billion, a bit less than 2016's $2,528 billion. The Q4 amount was 10.2% of GDP and the year 2017 was 12.8%, right in the middle of the general range of 10-15% that has prevailed since 2012. For comparison, the ratio averaged almost 29% in the five years before the Great Recession and just under 20% over long stretches before then.
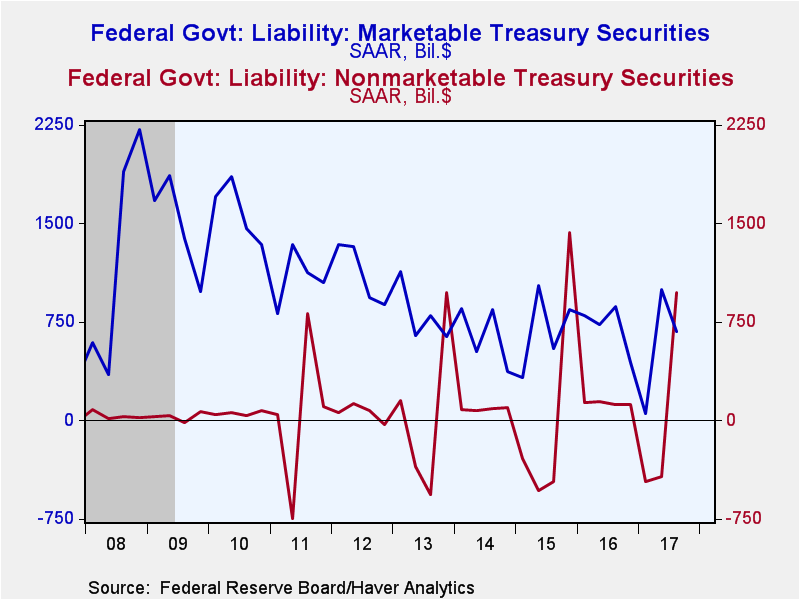
The federal government was again the main source of change in borrowing patterns, as it raised $1,656 billion SAAR in Q3, but then paid down $32 billion in Q4. A swing in nonmarketable debt was the main mover, as federal government retirement and savings funds, especially the Thrift Savings Plan G Fund, raised $534 billion in Q3 and paid down $596 billion in Q4. Marketable debt was also stronger in Q3, raising $678 billion in Q3, tapering to $488 billion in Q4. The total of federal government borrowing in the year 2017 was "just" $447 billion, markedly less than 2016's $841 billion.
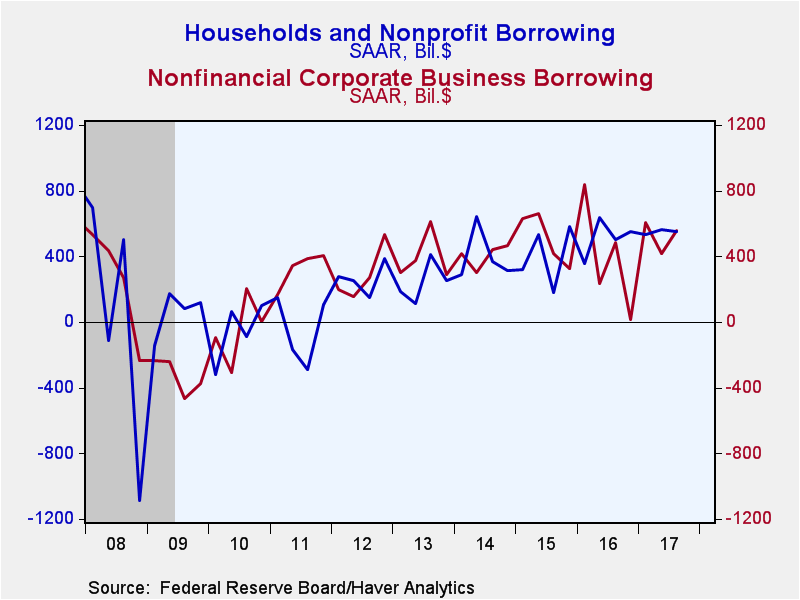
Nonfinancial corporate business borrowing was the other source of the swing up in Q3 and down in Q4. Corporations raised $636 billion SAAR in Q3, diminishing to $176 billion in Q4. Issuance of corporate bonds was $335 billion in Q3, and then only $63 billion in Q4. Loans from depository institutions and other lenders also moderated, from $243 billion in Q3 to just $70 billion in Q4. For the year as a whole, corporate business borrowed $490 billion, up from $401 billion in 2016.
Financial institutions also reduced their debt usage in Q4, raising $322 billion after $561 billion in Q3. They used almost the same amount for the year as a whole, $434 billion, compared to $429 billion in 2016.
Households, in something of a contrast, used more credit in Q4, $789 billion, than in Q3, $516 billion. Again all these amounts are seasonally adjusted annual rates. The major part of the Q4 pick-up was consumer credit, which increased $292 billion versus $134 billion in Q1. Home mortgage borrowing was a bit more in Q4, $302 billion, compared to the $282 billion pace in Q3. Total household borrowing amounted to 5.4% of disposable personal income in Q4; this is up from 3.6% in Q3 and is the highest ratio in any quarter since Q1 2008. For all of 2017, the ratio of borrowing to disposable income was 4.2%, and this is the highest year since 2007. However, ratios for several years before then were noticeably above 10%. So people continue to be at least relatively conservative in their use of credit.
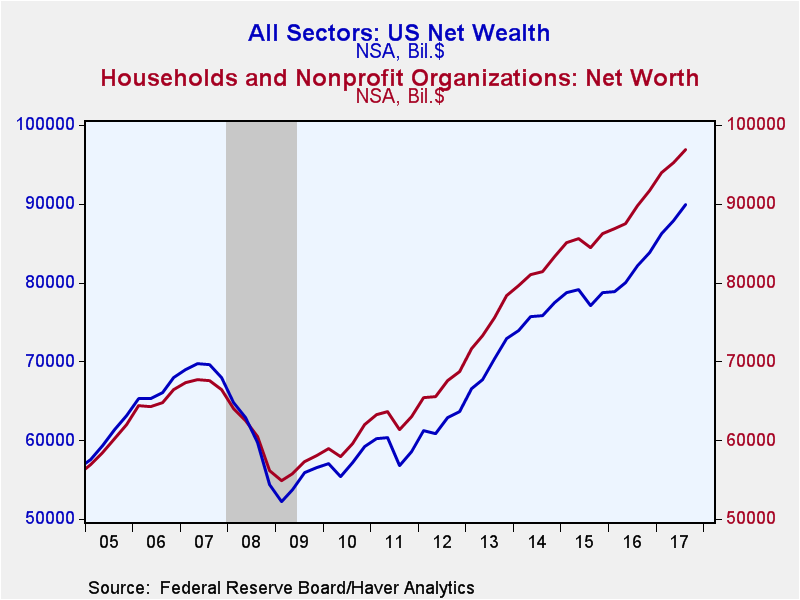
Press reports of these Financial Accounts highlight household balance sheets and net worth, and with a continuing rise in the stock market, they describe the latest quarter-end amount, $98.7 trillion, as yet another record (level, not seasonally adjusted). Holdings of corporate shares rose $831 billion (quarterly rate, not seasonally adjusted), larger than the Q3 increase of $589 billion. For all of 2017, stock holdings gained $2,668 billion. Homeowners' equity rose $375 billion in Q4, following a gain of $205 billion in Q3; for the whole year, this was up $1,244 billion.
Net wealth of the total economy moved ahead $2.4 trillion in Q4 to $92.1 trillion from $89.6 trillion at end-Q3 (also levels, not seasonally adjusted). The total market value of domestic corporations rose to $36.8 trillion from $35.0 trillion. Net financial claims on the "rest of the world" remained nearly steady at -$6.22 trillion at end-Q4 versus -$5.99 trillion the quarter before. The remainder of the net wealth measure consists of nonfinancial assets held by households, noncorporate business and governments; these totaled $61.5 trillion at year-end, up $834 billion from end-Q13 and $3,004 billion for all of 2017.
The Financial Accounts data are in Haver's FFUNDS database. Associated information is compiled in the Integrated Macroeconomic Accounts produced jointly with the Bureau of Economic Analysis (BEA); these are carried in Haver's USNA database.
Carol Stone, CBE
AuthorMore in Author Profile »Carol Stone, CBE came to Haver Analytics in 2003 following more than 35 years as a financial market economist at major Wall Street financial institutions, most especially Merrill Lynch and Nomura Securities. She had broad experience in analysis and forecasting of flow-of-funds accounts, the federal budget and Federal Reserve operations. At Nomura Securities, among other duties, she developed various indicator forecasting tools and edited a daily global publication produced in London and New York for readers in Tokyo. At Haver Analytics, Carol was a member of the Research Department, aiding database managers with research and documentation efforts, as well as posting commentary on select economic reports. In addition, she conducted Ways-of-the-World, a blog on economic issues for an Episcopal-Church-affiliated website, The Geranium Farm. During her career, Carol served as an officer of the Money Marketeers and the Downtown Economists Club. She had a PhD from NYU's Stern School of Business. She lived in Brooklyn, New York, and had a weekend home on Long Island.


