 Global| Sep 18 2014
U.S. Financial Accounts Show Overall Pickup in Credit Market Borrowing
Summary
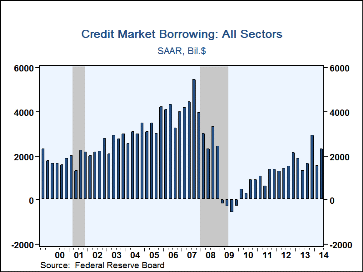
The Federal Reserve's financial accounts data (formerly known as the "flow of funds") for Q2 show total credit market borrowing at $2.32 trillion annual rate, up from $1.56 trillion in Q1. That earlier period is revised from $2.00 [...]
 The Federal Reserve's financial accounts data (formerly known as the "flow of funds") for Q2 show total credit market borrowing at $2.32 trillion annual rate, up from $1.56 trillion in Q1. That earlier period is revised from $2.00 trillion reported in June; revisions in the total and for most categories extend back several years. All the data here are quoted at seasonally adjusted annual rates.
The Q2 amount is 13.4% of GDP, up from 9.2% in Q1. The 20-year average ratio to GDP has ranged around 17-18%; it peaked at 37.3% in Q3 2007, just at the peak of the business cycle; there were total net paydowns during 2009, in the depth of the recession.
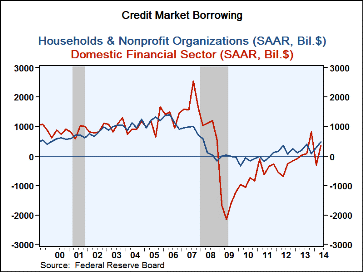
The pickup in Q2 borrowing came in the household sector and in financial institutions. Households borrowed at a $471 billion rate compared to $295 billion in Q1; the Q2 amount is the largest since Q1 2008, as the financial crisis was building. In this latest period, home mortgages showed a tiny net increase of $35 billion after a liquidation of $58 billion in Q1; Q2 was just the third positive quarter since the end of 2009. Consumer credit expanded at a $254 billion rate, following $201 billion in Q1; student loans, auto loans and credit card debt all participated in the pickup.
The domestic financial sector had paid down debt in Q1, at a $295 billion rate, but borrowed at a $353 billion annual rate in Q2. Government-sponsored enterprises, that is, mainly Fannie Mae and Freddie Mac, reversed their Q1 liquidation of $355 billion in borrowing $156 billion in Q2. Depository institutions, i.e., mostly commercial banks, also had net borrowing in Q2, $106 billion, after a paydown in Q1 of $26 billion. Most other financial sector firms had marginal changes in borrowing during Q2.
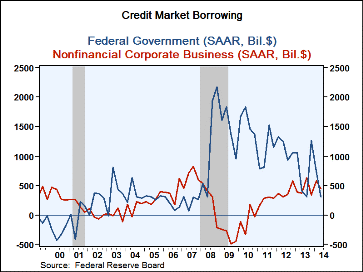
The gains in household and financial institution borrowing were partially offset by slowdowns in federal government and nonfinancial corporation borrowing. Federal government debt increased at a $314 billion annual rate in Q2, much less than the $741 billion rate of Q1 and the second smallest amount since early 2008, also as the recession was getting underway.
Nonfinancial corporations borrowed $444 billion in Q2 following $586 billion in Q1; that was revised downward from $873 billion reported before. The Q2 slowdown came in corporate bonds, $225 billion versus $283 billion in Q1, and "other loans" (mostly from the federal government, rest-of-the-world lenders and finance companies), which amounted to $45 billion after $159 billion in Q1. Commercial paper use also tapered. In contrast, loans from depository corporations picked up to an $82 billion pace from $37 billion in Q1 and were the largest amount since late 2012.
The Financial Accounts data are in Haver's FFUNDS database. Associated information is compiled in the Integrated Macroeconomic Accounts produced jointly with the Bureau of Economic Analysis (BEA); these are carried in Haver's USNA database.
Carol Stone, CBE
AuthorMore in Author Profile »Carol Stone, CBE came to Haver Analytics in 2003 following more than 35 years as a financial market economist at major Wall Street financial institutions, most especially Merrill Lynch and Nomura Securities. She had broad experience in analysis and forecasting of flow-of-funds accounts, the federal budget and Federal Reserve operations. At Nomura Securities, among other duties, she developed various indicator forecasting tools and edited a daily global publication produced in London and New York for readers in Tokyo. At Haver Analytics, Carol was a member of the Research Department, aiding database managers with research and documentation efforts, as well as posting commentary on select economic reports. In addition, she conducted Ways-of-the-World, a blog on economic issues for an Episcopal-Church-affiliated website, The Geranium Farm. During her career, Carol served as an officer of the Money Marketeers and the Downtown Economists Club. She had a PhD from NYU's Stern School of Business. She lived in Brooklyn, New York, and had a weekend home on Long Island.
More Economy in Brief
 Global| Feb 05 2026
Charts of the Week: Balanced Policy, Resilient Data and AI Narratives
by:Andrew Cates


