 Global| Jun 07 2019
U.S. Financial Accounts Show Q1 Rebound in Borrowing
Summary
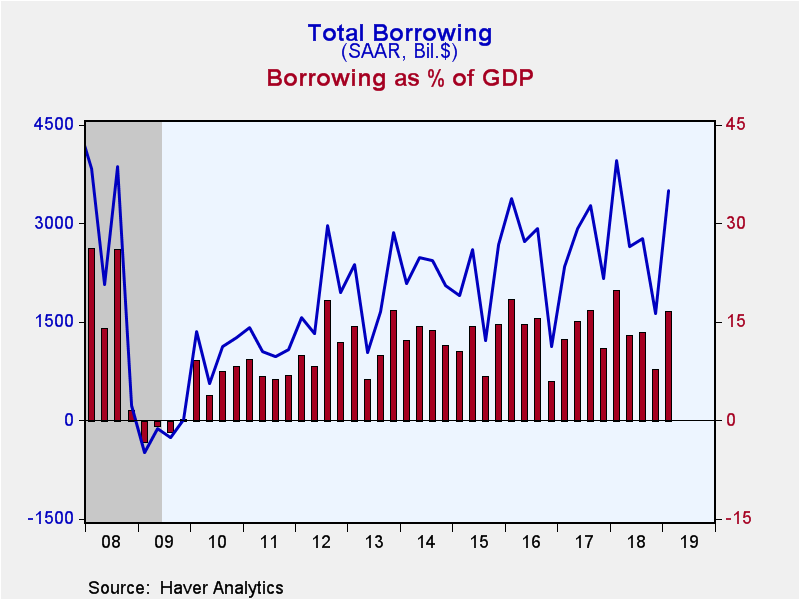
Total borrowing in U.S. financial markets was $3,504 billion in Q1 2019, more than double the Q4 2018 amount of $1,633 billion, according to the Federal Reserve's Financial Accounts data, which were published Thursday, June 6. The [...]
Total borrowing in U.S. financial markets was $3,504 billion in Q1 2019, more than double the Q4 2018 amount of $1,633 billion, according to the Federal Reserve's Financial Accounts data, which were published Thursday, June 6. The borrowing amounted to 16.6% of GDP in Q1, compared to just 7.8% in Q4. The Q1 ratio to GDP was relatively high in recent history, but can be seen in the context of the relatively small amount in Q4; clearly it will be important to see whether any heavier borrowing trend develops in the near future. Note that all the numbers quoted here are seasonally adjusted annual rates.
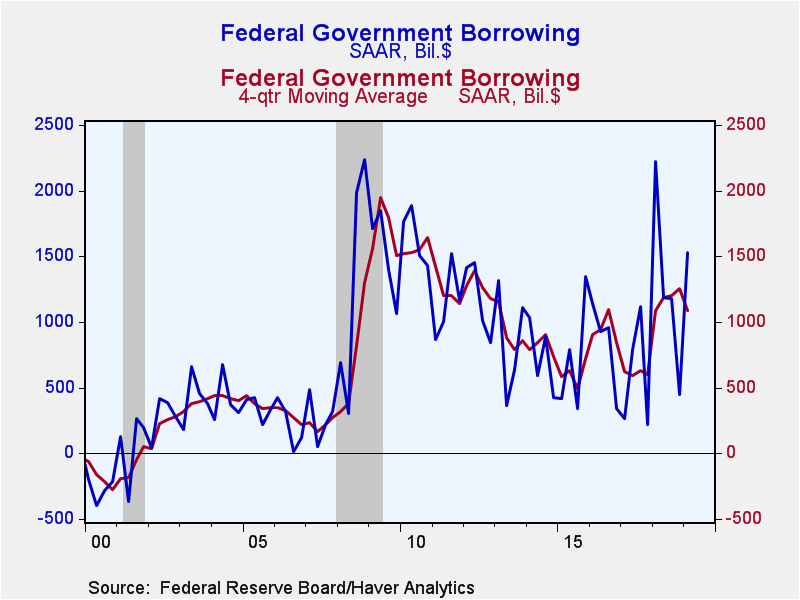
Every major sector except households participated in the Q1 borrowing increase, and even the reduction in household borrowing was quite modest. The federal government borrowed $1,531 billion, and that must be compared to the relatively small amount in Q4 of $444 billion. Indeed, a four-quarter moving average is seen to decrease from $1.258 billion in Q4 to $1.085 billion in Q1.
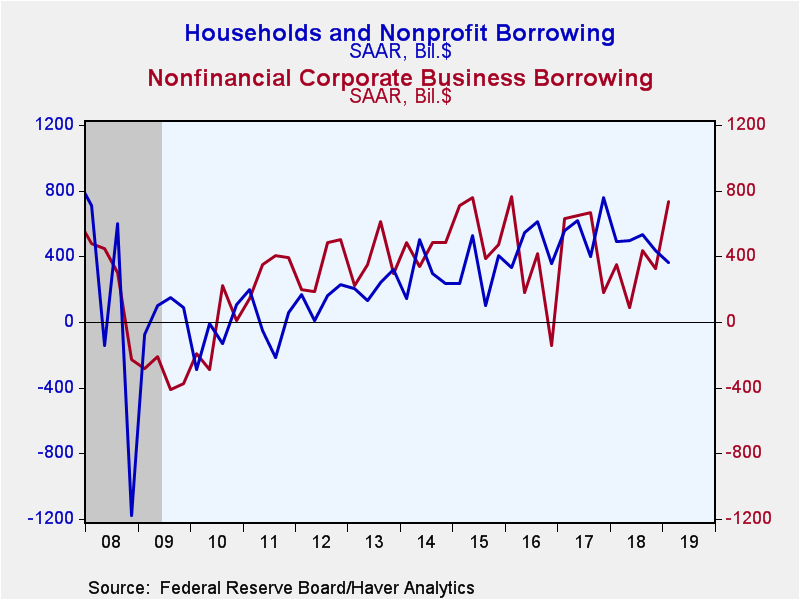
Nonfinancial corporate business borrowing also rose substantially in Q1, totaling $737 billion, more than double the Q4 amount of $323 billion. In Q1, there were sizable increases in two major forms of corporate borrowing; net new bond issuance was $303 billion, up from just $85 billion in Q4, and commercial paper issuance was $107 billion after a net paydown of $143 billion in Q4. Net new loans to businesses, by contrast, saw a modest decrease to $314 billion in Q1 from $367 billion in Q4. The overall increase in corporate debt represented 33.4% of corporate capital outlays in Q1; this is the largest share since the middle of 2017, but is still in a range that otherwise prevailed during the post-Great-Recession period. What is more likely is that the tax reform law that took effect at the beginning of 2018 reduced the amount of borrowing companies had to do then to finance capital expenditures.
Financial institutions borrowed $535 billion in Q1, up from $438 billion in Q4. This represents 2.5% of GDP and remains close in line with the magnitude of those institutions’ funding needs over the last five or six years.
Regarding households, the decrease in Q1 borrowing took place in consumer credit, specifically in revolving credit (credit cards) and student loans. Household borrowing totaled $174 billion in Q1, down from $215 billion in Q4. Revolving credit increased just $16 billion in Q1, less than one-third of the $52 billion in Q4. Student loans increased $60 billion in Q1, slightly less than the $84 billion in Q4. Auto loans and “other” credit had marginally larger increases in Q1 than in Q4. Home mortgages picked up slightly in Q1, increasing $251 billion versus $229 billion the quarter before. All together, household borrowing amounted to 1.6% of disposable personal income in Q1, barely more than the 1.5% in Q4; for comparison, the pre-Great-Recession period saw as much as 12.5% and in 2007, it was still 6.8%.
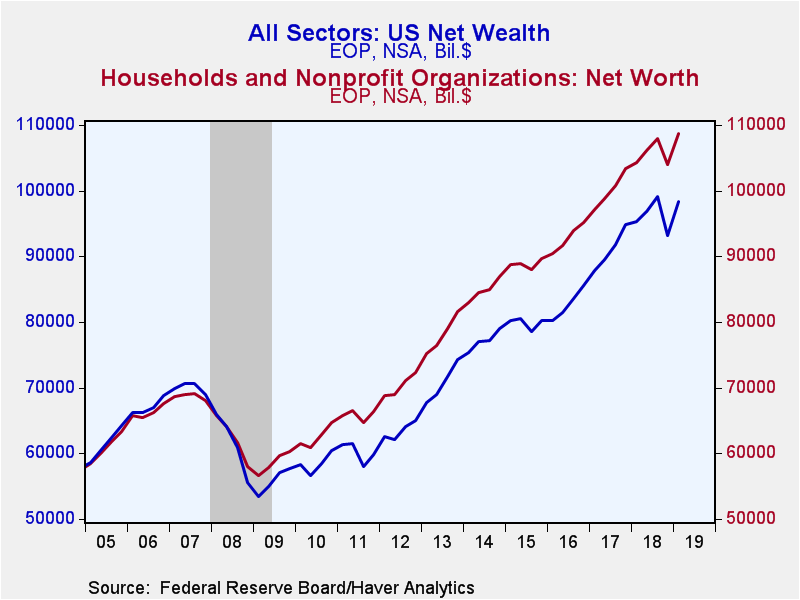
The Fed’s press release of these Financial Accounts and the associated press reports highlight household balance sheets and net worth. Household net worth rebounded in Q1, as the stock market came back from its late autumn decline. Net worth was $108.6 trillion on March 31 (amount outstanding, not seasonally adjusted), compared to $104.0 trillion at year-end. The Q1 amount was 684% of disposable personal income, up from 660% at year-end. In Q1, households' holdings of corporate equities and mutual fund shares rose by $2.823 trillion (not seasonally adjusted quarterly change) after falling $4.329 trillion in Q4, while holdings of debt securities and money fund shares increased $215 billion, actually a bit less that Q4’s $452 billion. Real estate holdings and other nonfinancial assets gained $459 billion in Q1 after $327 billion in Q4. Household liabilities were virtually flat, rising just $6 billion after a $132 billion increase in Q4. Home mortgage liabilities were $10.356 trillion, which represents 39.6% of household real estate holdings, down from 40.0% at the end of Q4; the Q1 amount is the smallest fraction since Q1 2002 and contrasts with 63.3% in Q1 2009 in the midst of the Great Recession financial crisis.
Net wealth of the total U.S. economy recovered $5.078 trillion in Q1 after the stock-market-driven drop of $5.864 trillion in Q4. It amounted to $98.3 trillion on March 31, up from $93.2 billion at year-end 2018 (levels, not seasonally adjusted). The associated market value of domestic corporations rose $4.486 trillion in Q1 after the $6.462 trillion drop in Q4. Net financial claims on the "rest of the world" were -$6.596 trillion on March 31, a bit larger than the -$6.393 trillion deficit on December 31. The remainder of the net wealth measure consists of nonfinancial assets held by households, noncorporate business and governments; these totaled $65.434 trillion on March 31, up $796 billion from December 31.
The Financial Accounts data are in Haver's FFUNDS database. Associated information is compiled in the Integrated Macroeconomic Accounts produced jointly with the Bureau of Economic Analysis (BEA); these are carried in Haver's USNA database as well as in FFUNDS.
Carol Stone, CBE
AuthorMore in Author Profile »Carol Stone, CBE came to Haver Analytics in 2003 following more than 35 years as a financial market economist at major Wall Street financial institutions, most especially Merrill Lynch and Nomura Securities. She has broad experience in analysis and forecasting of flow-of-funds accounts, the federal budget and Federal Reserve operations. At Nomura Securites, among other duties, she developed various indicator forecasting tools and edited a daily global publication produced in London and New York for readers in Tokyo. At Haver Analytics, Carol is a member of the Research Department, aiding database managers with research and documentation efforts, as well as posting commentary on select economic reports. In addition, she conducts Ways-of-the-World, a blog on economic issues for an Episcopal-Church-affiliated website, The Geranium Farm. During her career, Carol served as an officer of the Money Marketeers and the Downtown Economists Club. She has a PhD from NYU's Stern School of Business. She lives in Brooklyn, New York, and has a weekend home on Long Island.


