 Global| Dec 06 2012
U.S. Flow-of-Funds Data Show Slower Credit Market Borrowing in Q3
Summary
The Federal Reserve quarterly Flow-of-Funds data show some easing in credit market borrowing in Q3, at $887 billion, seasonally adjusted annual rate, down from $1,166 billion in Q2, $1,415 billion in Q1 and an average of $929 billion [...]
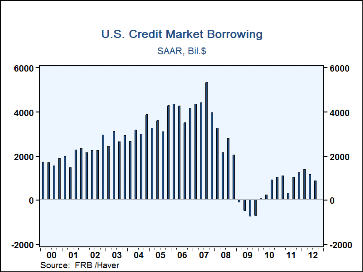
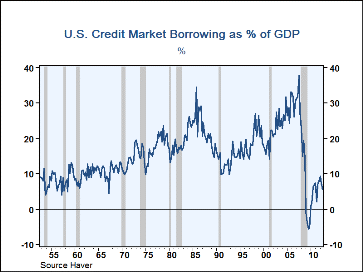
The Federal Reserve quarterly Flow-of-Funds data show some easing in credit market borrowing in Q3, at $887 billion, seasonally adjusted annual rate, down from $1,166 billion in Q2, $1,415 billion in Q1 and an average of $929 billion for all of 2011. The Q3 figure was 5.6% of GDP, compared to a long-term (20 years) average of 18.0%. We last looked at these data six months ago, and we see that what appeared to be an improving trend last winter seems to have paused in both Q2 and Q3. Obviously, there can be too much borrowing, as from 2003 to 2007, when these ratios to GDP ran in a range of 25 to more than 30%. At the same time, some use of credit helps move the economy forward more consistently, and such a pattern seems not to have re-emerged yet.
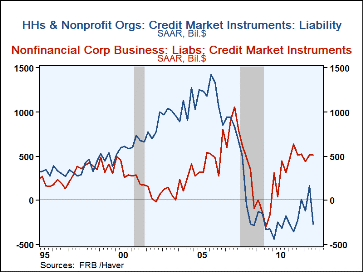
On reason for the slowing in borrowing in Q3 comes from a return to net liquidation in the household sector, which paid down $262 billion in debt then. Home mortgages remain in decline, by $291 billion; only one quarter since the middle of 2008 has seen a positive mortgage borrowing, and that was a mere $21 billion in Q1 2009. The other household item contributing to credit liquidation this time may not actually be a household liability; the Federal Reserve has made loans to various financial institutions, such as hedge funds which are incorporated in this sector reflecting its origin as a "residual". In this circumstance, lending that does not appear in corporate, banking system or balance of payments source statements and other compilations might show up in the "household" sector, even though consumers are not the specific borrowers. This "depository institution lending" was -$64 billion in Q3, a swing from +$221 billion in Q2.
The federal government borrowed in Q3, but at a much slower pace than in most recent quarters, $690 billion, down from $1,183 billion in Q2 and $1,428 billion in Q1. [Recall in considering these figures, that they are all seasonally adjusted annual rates, so they might look strange for quarterly amounts.] Nonfinancial corporate business borrowed at a $510 billion rate in Q3, almost exactly the same amount as the $511 billion in Q2.
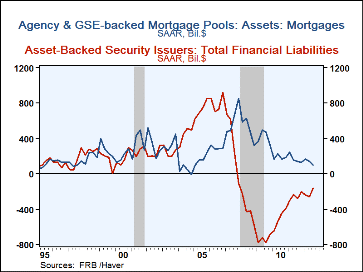
Financial sectors were still paying down sharply, $609 billion in Q3 versus $494 billion of liquidation in Q2. Depository institutions, government-sponsored enterprises and private sector asset-backed securities issuers are all still working down their liabilities. Federal agency and GSE-backed mortgage pools raised funds, but at $95 billion, this was the smallest quantity since late in 2004, just as the huge mid-decade borrowing binge was getting under way. These government-sponsored mortgage-backed securities issuers raised $852 billion at their peak in Q4 2007.
The Flow-of-Funds data are in Haver's FFUNDS database.
| Flow of Funds (SAAR, Bil.$) | ||||||||
|---|---|---|---|---|---|---|---|---|
| Q3'12 | Q2'12 | Q1'12 | 2011 | 2010 | 2009 | 2008 | 2007 | |
| Total Credit Market Borrowing* | 887 | 1166 | 1415 | 929 | 574 | -540 | 2564 | 4513 |
| Federal Government | 690 | 1183 | 1428 | 1068 | 1580 | 1444 | 1239 | 237 |
| Households | -262 | 161 | -121 | -209 | -296 | -232 | -26 | 867 |
| Nonfinancial Corporate Business | 510 | 511 | 440 | 534 | 279 | -146 | 341 | 838 |
| Financial Sectors | -609 | -494 | -1010 | -556 | -980 | -1844 | 902 | 1815 |
| *Includes noncorporate business, state & local governments and the rest-of-the-world sector, not shown separately. | ||||||||
Carol Stone, CBE
AuthorMore in Author Profile »Carol Stone, CBE came to Haver Analytics in 2003 following more than 35 years as a financial market economist at major Wall Street financial institutions, most especially Merrill Lynch and Nomura Securities. She had broad experience in analysis and forecasting of flow-of-funds accounts, the federal budget and Federal Reserve operations. At Nomura Securities, among other duties, she developed various indicator forecasting tools and edited a daily global publication produced in London and New York for readers in Tokyo. At Haver Analytics, Carol was a member of the Research Department, aiding database managers with research and documentation efforts, as well as posting commentary on select economic reports. In addition, she conducted Ways-of-the-World, a blog on economic issues for an Episcopal-Church-affiliated website, The Geranium Farm. During her career, Carol served as an officer of the Money Marketeers and the Downtown Economists Club. She had a PhD from NYU's Stern School of Business. She lived in Brooklyn, New York, and had a weekend home on Long Island.


