 Global| Aug 26 2011
U.S. GDP Headline Revised Lower, but Final Demand Looks Better
Summary
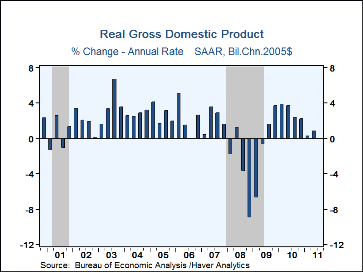
The headline on the Commerce Department's revision of Q2 real GDP shows a cut to 1.0% growth (SAAR) from the 1.3% reported a month ago. However, domestic final sales were strengthened to 1.1% from 0.5% in the advance release. This [...]
The headline on the Commerce Department's revision of Q2 real GDP shows a cut to 1.0% growth (SAAR) from the 1.3% reported a month ago. However, domestic final sales were strengthened to 1.1% from 0.5% in the advance release. This growth is still disappointingly sluggish, but it marks a notable pickup from both that initial figure and the 0.4% in Q1. Consensus estimates had called for GDP growth of 1.1%. The downward revisions in the total came from inventories and more negative net exports; in particular, the inventory change was revised from $49.6 billion in the advance release to $40.6 billion. Export growth was reduced from 6.0% to 3.1% while imports were revised upward from 1.3% growth to 1.9%; net exports were changed from -$405.7 billion to -$421.3 billion.
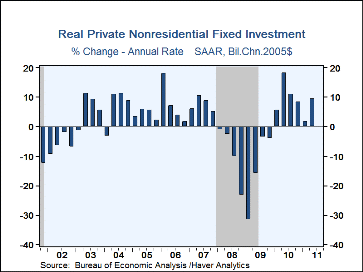
For all the heavy feeling about feeble growth, the upward revisions in final demand came in a category that would usually signal economic strength, that is, business investment. Growth in nonresidential fixed investment was raised from 6.3% to 9.9%. Construction in particular was lifted from 8.1% growth to 15.7%, now indicating that its 14.3% plunge in Q1 is almost completely offset. Equipment outlays were raised from 5.7% growth to 7.9%. Among other sectors, consumer spending was revised from 0.1% to 0.4%. That gain was in nondurable goods and services; purchases of durable goods did weaken even more, as they were revised from a contraction of 4.4% to -5.5%. Government consumption and investment was lifted modestly from a 1.1% contraction to -0.9%; the reduced decline was in state and local outlays, while federal purchases were cut slightly.
Price inflation was little changed, as the chain price index moved from a 2.3% rate of increase to 2.4%.
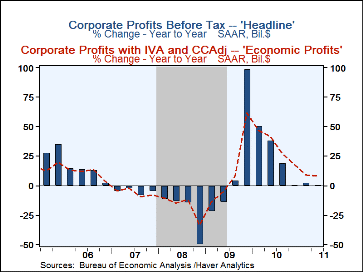
This GDP report included the first look at Q2 corporate profits. As with overall GDP the headline figure doesn't inspire much confidence; profits before taxes and without IVA and CCAdj increased a mere 0.5% from Q1 and just 1.1% from a year ago. Total economic profits, though, including the inventory valuation adjustment and capital consumption adjustment, gained 3.0% on the quarter (quarterly rate, as is customary for profits), the best quarter-to-quarter performance since Q2 2010. The total over the last year, though, is 8.3%, which is a bit slower than prior year-on-year moves. The key here is the financial sector; its profits in Q2 were down 11.5% from Q1 (again a quarterly rate). Nonfinancial industry profits, by contrast, were up 8.5% on the quarter and 14.2% from a year ago; also, rest-of-world profits grew 6.6% in the quarter and 12.1% over a year ago.
The latest GDP figures can be found in Haver's USECON and USNA databases; USNA contains basically all of the Bureau of Economic Analysis' detail on the national accounts, including the new integrated economics accounts and the recently added GDP data for U.S. Territories. The Consensus estimates can be found in AS1REPNA.
| Chained 2005 $, % AR | Q2'11 (2nd Rel) |
Q2'11 (Adv) |
Q1'11 | Q4'10 | Q2'11 Y/Y |
2010 | 2009 | 2008 |
|---|---|---|---|---|---|---|---|---|
| Gross Domestic Product | 1.0 | 1.3 | 0.4 | 2.3 | 1.5 | 3.0 | -3.5 | -0.3 |
| Inventory Effect | -0.2 | 0.2 | 0.3 | -1.8 | -0.1 | 1.6 | -0.8 | -0.5 |
| Final Sales | 1.2 | 1.1 | 0.0 | 4.2 | 1.8 | 1.4 | -2.6 | 0.2 |
| Foreign Trade Effect | 0.1 | 0.6 | -0.3 | 1.4 | 0.2 | -0.4 | 1.0 | 1.2 |
| Domestic Final Sales | 1.1 | 0.5 | 0.4 | 2.7 | 1.6 | 1.8 | -3.6 | -1.0 |
| Demand Components | ||||||||
| Personal Consumption | 0.4 | 0.1 | 2.1 | 3.6 | 2.2 | 2.0 | -1.9 | -0.6 |
| Business Fixed Investment | 9.9 | 6.3 | 2.1 | 8.7 | 7.9 | 4.4 | -17.9 | -0.8 |
| Residential Investment | 3.4 | 3.8 | -2.4 | 2.5 | -7.0 | -4.3 | -22.2 | -23.9 |
| Government Spending | -0.9 | -1.1 | -5.9 | -2.8 | -2.2 | 0.7 | 1.7 | 2.6 |
| Chain-Type Price Index | ||||||||
| GDP | 2.4 | 2.3 | 2.5 | 1.9 | 2.6 | 1.2 | 1.1 | 2.2 |
| Final Sales of Domestic Product | 2.4 | 2.3 | 2.4 | 1.8 | 2.0 | 1.2 | 1.0 | 2.2 |
| Final Sales to Domestic Purchasers | 3.3 | 3.2 | 3.9 | 2.0 | 2.5 | 1.5 | -0.1 | 3.3 |
Carol Stone, CBE
AuthorMore in Author Profile »Carol Stone, CBE came to Haver Analytics in 2003 following more than 35 years as a financial market economist at major Wall Street financial institutions, most especially Merrill Lynch and Nomura Securities. She had broad experience in analysis and forecasting of flow-of-funds accounts, the federal budget and Federal Reserve operations. At Nomura Securities, among other duties, she developed various indicator forecasting tools and edited a daily global publication produced in London and New York for readers in Tokyo. At Haver Analytics, Carol was a member of the Research Department, aiding database managers with research and documentation efforts, as well as posting commentary on select economic reports. In addition, she conducted Ways-of-the-World, a blog on economic issues for an Episcopal-Church-affiliated website, The Geranium Farm. During her career, Carol served as an officer of the Money Marketeers and the Downtown Economists Club. She had a PhD from NYU's Stern School of Business. She lived in Brooklyn, New York, and had a weekend home on Long Island.
More Economy in Brief
 Global| Feb 05 2026
Charts of the Week: Balanced Policy, Resilient Data and AI Narratives
by:Andrew Cates


