 Global| Sep 21 2020
U.S. Government Borrowing Surge Dominates Fed's Financial Accounts in Q2
Summary
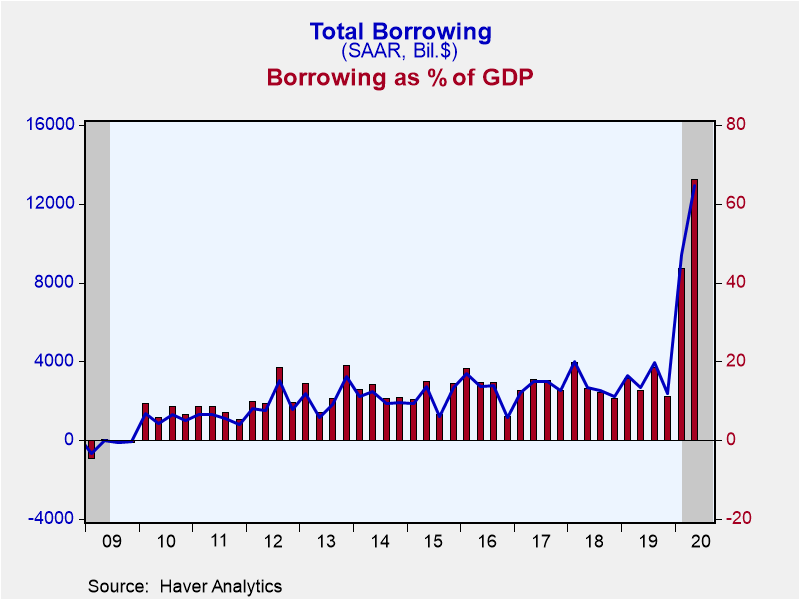
• Gov't borrowing equals record 66.2% of Q2 GDP. • Private sector borrowing slows. • Net worth features upturn in stock prices during Q2. The massive increase in federal government outlays tied to the COVID-19 impact on the U.S. [...]
• Gov't borrowing equals record 66.2% of Q2 GDP.
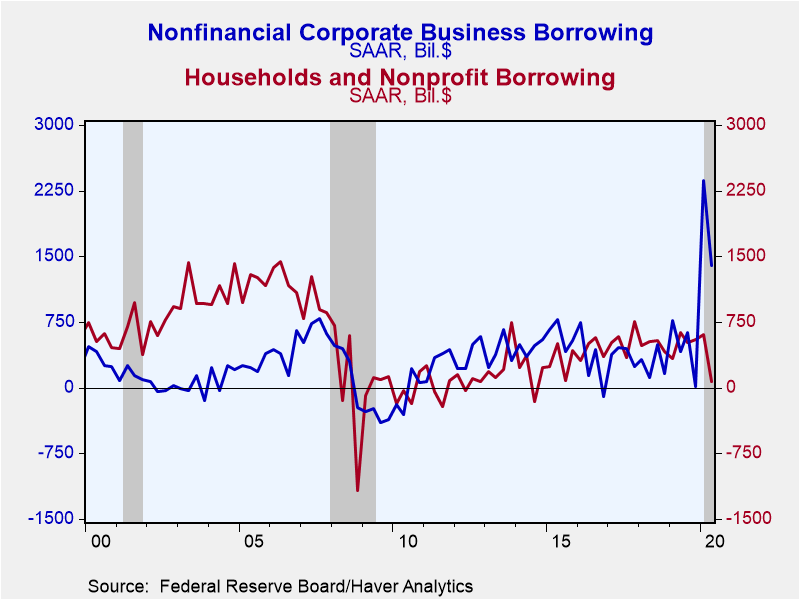
• Private sector borrowing slows.
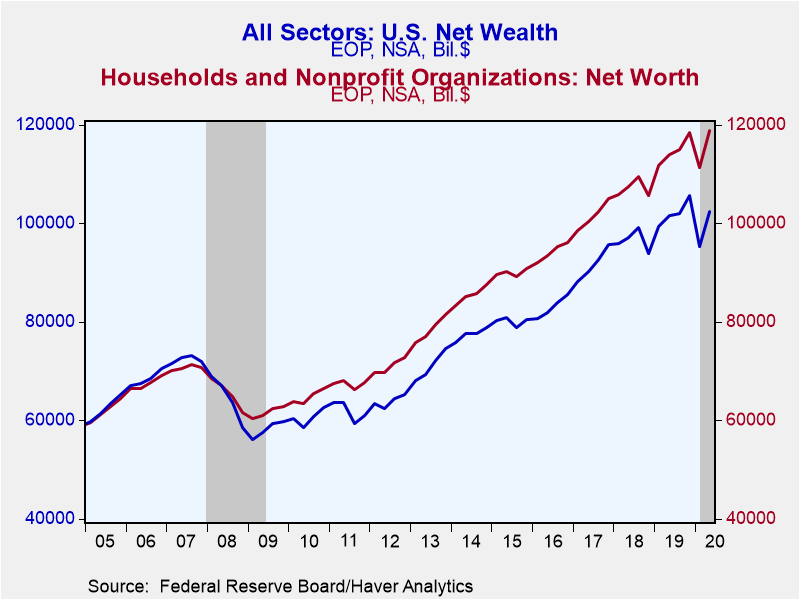
• Net worth features upturn in stock prices during Q2.
The massive increase in federal government outlays tied to the COVID-19 impact on the U.S. economy led to a dramatic increase in government borrowing and total borrowing in the U.S. financial system during Q2 2020. According to the Federal Reserve's Financial Accounts published today for Q2, borrowing totaled $12.907 trillion, representing 66.2% of GDP, up from $9.418 trillion in Q1, 43.7% of GDP. These are both substantially larger amounts than almost any previous period. Indeed, the previous record share of GDP was 38.5% in Q4 1985. Note that all the dollar figures quoted here are seasonally adjusted annual rates.
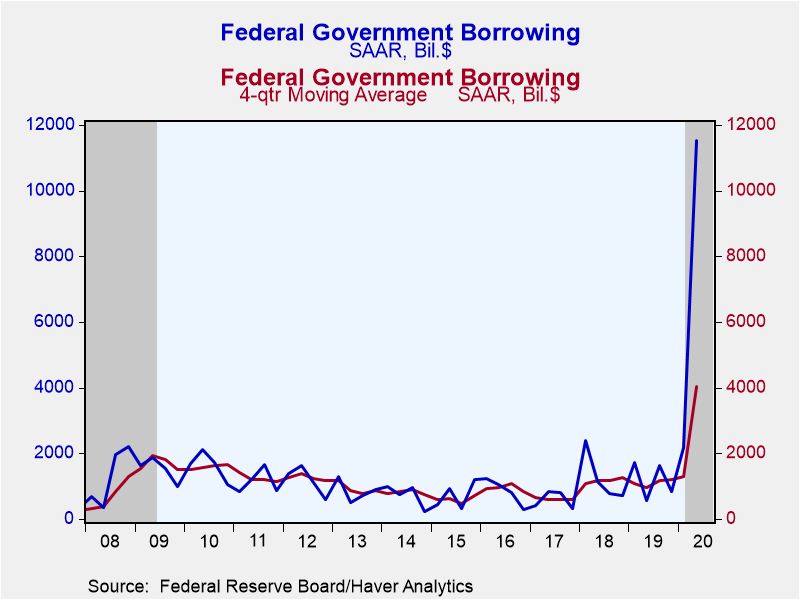
The federal government borrowing was closely tied to COVID-related outlays. According to the Financial Accounts data, the spending category known as social benefits doubled, from $2.4 trillion in Q1 to $4.9 trillion in Q2. "Other transfer payments" also doubled, from $682 billion in Q1 to $1.44 trillion in Q2, and subsidies mushroomed from $74 billion to $1.086 trillion. Receipts, by contrast, fell from $3.75 trillion to $3.47 trillion. These moves led to borrowing by the federal government of $11.535 trillion in Q2, compared to $2.734 trillion in Q1.
The next largest borrowing category in Q2 was nonfinancial corporate business, which borrowed $1.398 trillion. While this was noticeably smaller than the $2.369 trillion in Q1, it still included the largest amount of corporate bonds on record in these data, $1.698 trillion versus $684 billion in Q1. The offsets in total corporate borrowing were net paydowns in loans, $15 billion versus net issuance of $1.7 trillion in Q1 and a paydown of commercial paper of $282 billion, extending reductions of commercial paper outstanding into a fifth quarter.
Households noticeably reduced their borrowing, using just $75 billion, markedly smaller than their Q1 borrowing of $604 billion. The main move here was consumer credit, which was paid down by $276 billion. Single-family mortgage borrowing decreased slightly to $317 billion from $353 billion in Q1
Financial institutions had borrowed heavily for their category in Q1, $4.0 trillion, but paid down $1.4 trillion in Q2.
Net wealth in the total U.S. economy increased $7.068 trillion (quarterly rate, not annualized or seasonally adjusted) in Q2, a reversal of the $10.227 trillion reduction in Q1. This turnaround reflected a similar swing the market value of corporate equities, which had fallen $10 trillion in Q1 and recover $8.0 trillion in Q2. These moves are reflected in the household sector net worth, which saw a drop of $7.2 trillion in Q1 and a recovery of $7.6 trillion in Q2.
The Financial Accounts data are in Haver's FFUNDS database. Associated information is compiled in the Integrated Macroeconomic Accounts produced jointly with the Bureau of Economic Analysis (BEA); these are carried in Haver's USNA database as well as in FFUNDS.
| Financial Accounts (SAAR, Bil.$) | Q2'20 | Q1'20 | Q4'19 | 2019 | 2018 | 2017 | 2016 |
|---|---|---|---|---|---|---|---|
| Total Borrowing* | 12,907 | 9,418 | 2,391 | 4,396 | 3,082 | 2,853 | 2,721 |
| % of GDP | 66.2 | 43.7 | 11.0 | 18.4 | 14.4 | 13.8 | 13.9 |
| Federal Government | 11,535 | 2,734 | 712 | 1,919 | 1,191 | 1,258 | 599 |
| Households | 75 | 604 | 546 | 519 | 507 | 491 | 550 |
| Nonfinancial Corporate Business | 1,398 | 2,369 | 8 | 629 | 456 | 276 | 538 |
| Financial Sectors | -1,410 | 4,020 | 170 | 539 | 377 | 348 | 326 |
| Foreign Sector | 220 | -389 | 427 | 293 | 251 | 199 | 400 |
*Previously called "credit market borrowing" and includes debt securities plus loans. The total here includes borrowing by noncorporate business and state & local governments, not shown separately.
Carol Stone, CBE
AuthorMore in Author Profile »Carol Stone, CBE came to Haver Analytics in 2003 following more than 35 years as a financial market economist at major Wall Street financial institutions, most especially Merrill Lynch and Nomura Securities. She has broad experience in analysis and forecasting of flow-of-funds accounts, the federal budget and Federal Reserve operations. At Nomura Securites, among other duties, she developed various indicator forecasting tools and edited a daily global publication produced in London and New York for readers in Tokyo. At Haver Analytics, Carol is a member of the Research Department, aiding database managers with research and documentation efforts, as well as posting commentary on select economic reports. In addition, she conducts Ways-of-the-World, a blog on economic issues for an Episcopal-Church-affiliated website, The Geranium Farm. During her career, Carol served as an officer of the Money Marketeers and the Downtown Economists Club. She has a PhD from NYU's Stern School of Business. She lives in Brooklyn, New York, and has a weekend home on Long Island.


