 Global| Dec 11 2019
U.S. Government Budget Deficit Increases
Summary
The U.S. Treasury Department reported that the federal government ran a larger-than-expected $208.8 billion budget deficit during November, compared to a $204.9 bil. twelve months earlier. The Action Economics Survey anticipated a [...]
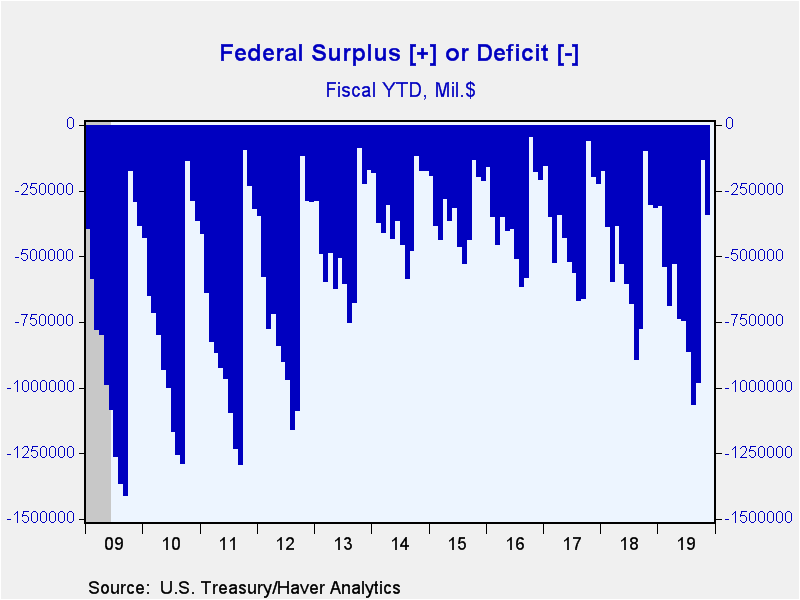
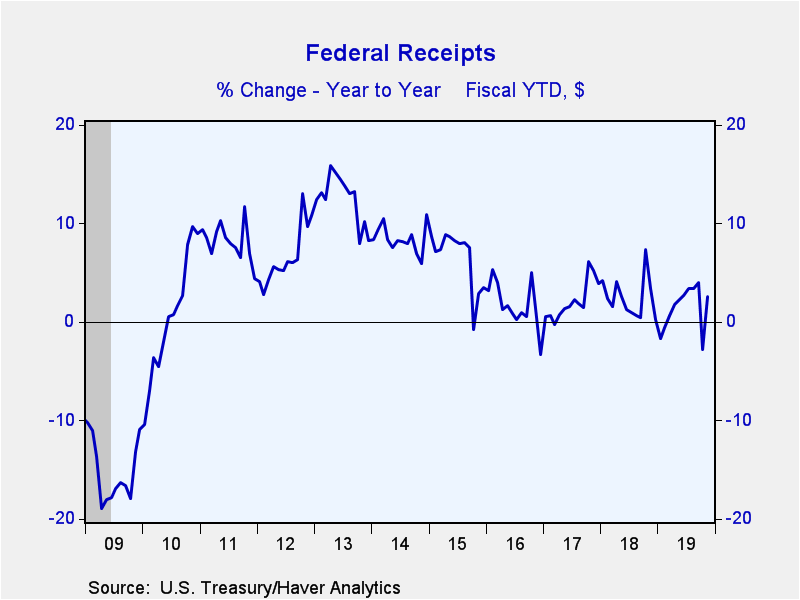
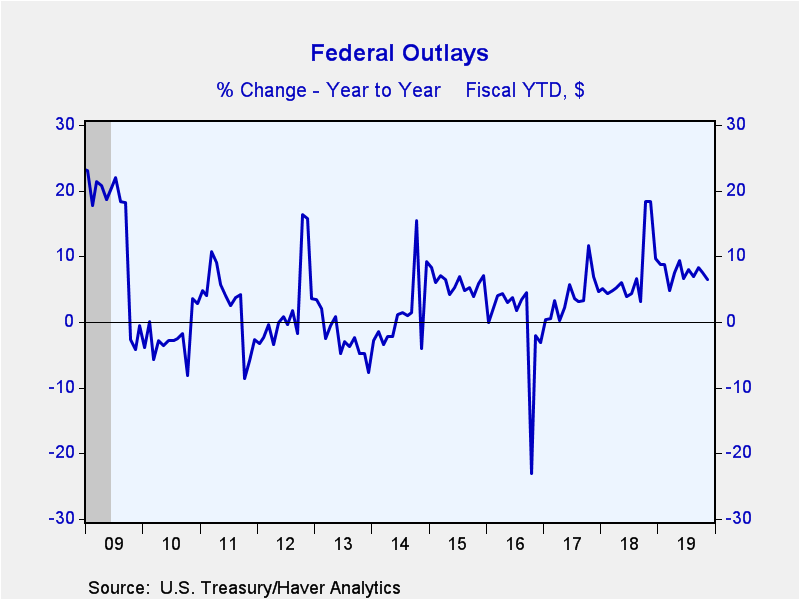
The U.S. Treasury Department reported that the federal government ran a larger-than-expected $208.8 billion budget deficit during November, compared to a $204.9 bil. twelve months earlier. The Action Economics Survey anticipated a $197.0 bil. deficit. For the first two months of the fiscal year, which begins in October, the deficit rose to $343.3 bil. from $305.4 bil. a year ago. On a fiscal year to date (FY) basis, federal government receipts rose 2.6% y/y, but this was more than offset by a 6.5% y/y gain in outlays.
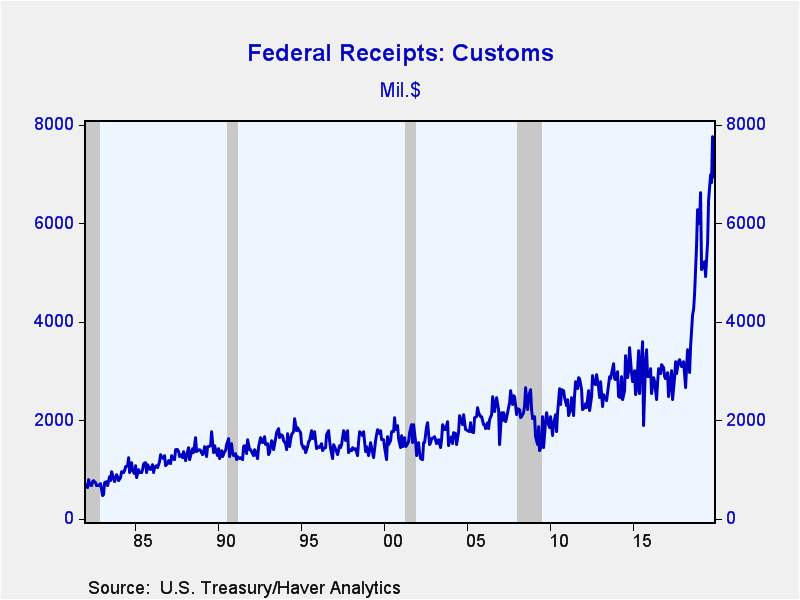
Outside of volatile excise taxes, which fell 39.1% FY y/y, receipts were relatively healthy. Personal income tax revenues grew 4.5% FY y/y, corporate tax receipts were up 11.8% y/y and customs duties which include tariffs jumped 24.2% y/y. As a result of increased tariffs, customs duties soared 71.4% in FY 2019 to $70.8 billion. However, spending on programs such as farm aid increased 81.8% to 23.0 billion. Also of note on the spending side was the surprising weakness in net interest outlays -0.8% FY y/y in November which is likely the result of calendar quirks. The Congressional Budget Office (CBO) anticipates net interest payment will grow 4.8% in FY 2020.
Haver's data on Federal Government outlays and receipts as well as CBO forecasts are contained in USECON; detailed data can be found in the GOVFIN database. The Action Economics Forecast Survey numbers are in the AS1REPNA database.
| United States Government Finance | November | FY'19 | FY'18 | FY'17 | FY'16 | |
|---|---|---|---|---|---|---|
| Budget Balance (Billions) | -- | $-208.84 | $-984.39 | $-779.00 | $-665.80 | $-664.80 |
| Fiscal YTD | -- | $-343.31 | -- | -- | -- | -- |
| As a percent of GDP | -- | -- | -4.6% | -3.8% | -3.5% | -3.2% |
| % of Total (FY 2019) | ||||||
| Net Revenues (Fiscal Year YTD 2020, Y/Y % Change) | 100 | 2.6 | 4.0 | 0.4 | 1.5 | 0.6 |
| Individual Income Taxes | 50 | 4.5 | 2.0 | 6.1 | 2.7 | 0.3 |
| Corporate Income Taxes | 7 | 11.8 | 12.5 | -31.1 | -0.8 | -12.9 |
| Social Insurance Taxes | 36 | 3.9 | 6.2 | 0.8 | 4.2 | 4.7 |
| Customs Duties | 2 | 24.2 | 71.4 | 19.5 | -0.8 | -0.6 |
| Net Outlays (Fiscal Year YTD 2020, Y/Y % Change) | 100 | 6.5 | 8.2 | 3.2 | 3.3 | 4.4 |
| National Defense | 15 | 6.9 | 8.9 | 5.4 | 0.9 | 0.6 |
| Health | 13 | 9.9 | 6.1 | 3.4 | 4.3 | 6.0 |
| Medicare | 15 | 7.5 | 10.6 | -1.4 | 0.5 | 8.8 |
| Income Security | 12 | 0.8 | 4.1 | -1.6 | -2.1 | 1.0 |
| Social Security | 23 | 6.2 | 5.7 | 4.5 | 3.1 | 3.2 |
| Veterans Benefits & Services | 4 | 5.4 | 11.8 | 1.3 | 1.2 | 9.3 |
| Education, Training, Employment & Social Services | 3 | 17.3 | 41.3 | -33.7 | 31.2 | -10.1 |
| Interest | 8 | -0.8 | 15.6 | 23.8 | 9.4 | 7.6 |
Gerald D. Cohen
AuthorMore in Author Profile »Gerald Cohen provides strategic vision and leadership of the translational economic research and policy initiatives at the Kenan Institute of Private Enterprise.
He has worked in both the public and private sectors focusing on the intersection between financial markets and economic fundamentals. He was a Senior Economist at Haver Analytics from January 2019 to February 2021. During the Obama Administration Gerald was Deputy Assistant Secretary for Macroeconomic Analysis at the U.S. Department of Treasury where he helped formulate and evaluate the impact of policy proposals on the U.S. economy. Prior to Treasury, he co-managed a global macro fund at Ziff Brothers Investments.
Gerald holds a bachelor’s of science from the Massachusetts Institute of Technology and a Ph.D. in Economics from Harvard University and is a contributing author to 30-Second Money as well as a co-author of Political Cycles and the Macroeconomy.
More Economy in Brief
 Global| Feb 05 2026
Charts of the Week: Balanced Policy, Resilient Data and AI Narratives
by:Andrew Cates


