 Global| Nov 13 2017
U.S. Government Budget Deficit Widens
by:Tom Moeller
|in:Economy in Brief
Summary
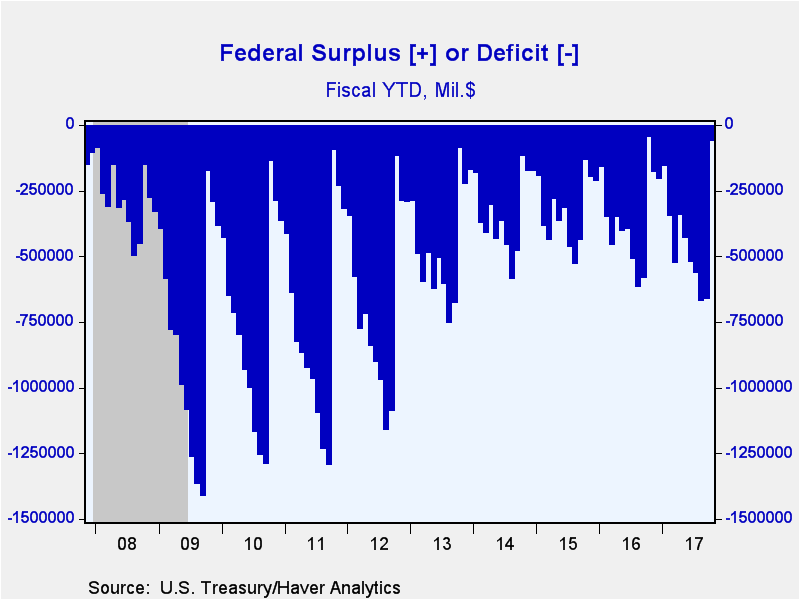
The U.S. Treasury Department reported that the federal government ran a $63.2 billion budget deficit during October compared to a $45.8 billion deficit in October 2016. A deficit of $49.0 billion had been expected in the Action [...]
The U.S. Treasury Department reported that the federal government ran a $63.2 billion budget deficit during October compared to a $45.8 billion deficit in October 2016. A deficit of $49.0 billion had been expected in the Action Economics Forecast Survey.
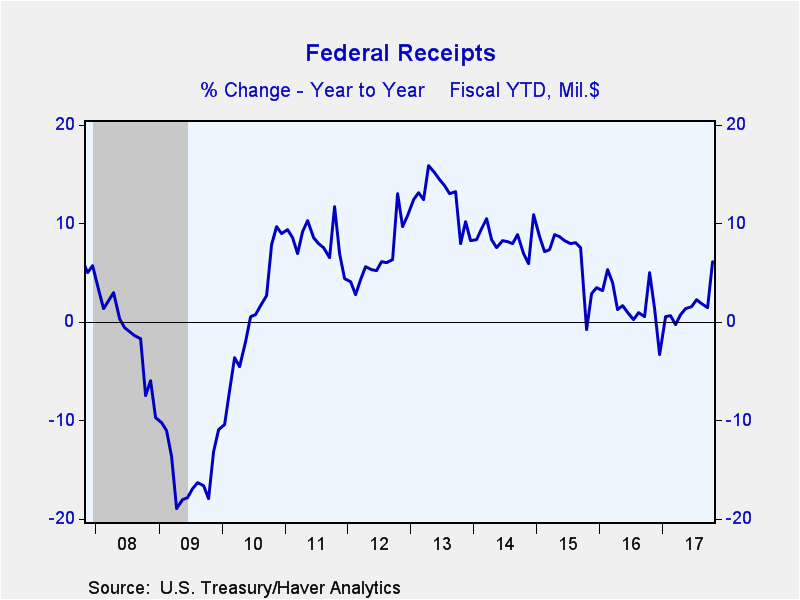
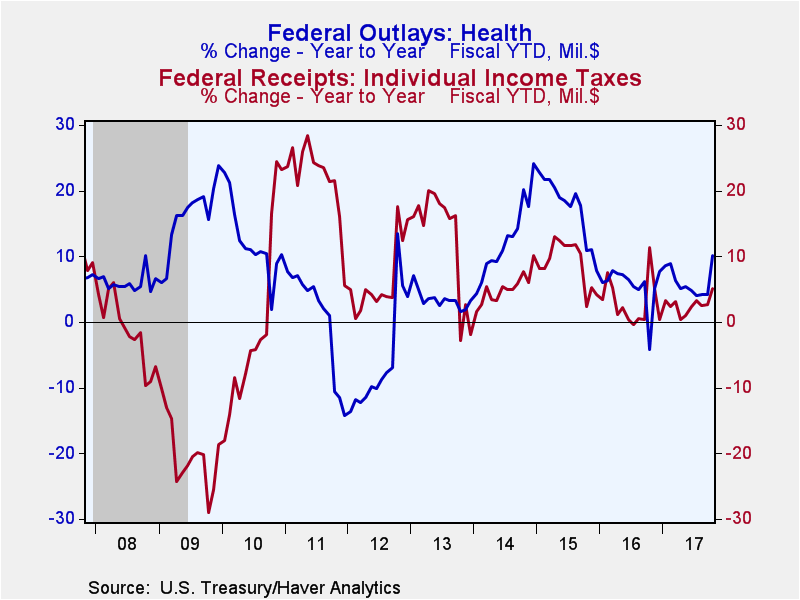
Net revenues increased 6.2% y/y as corporate income taxes surged by nearly two-thirds, after slipping during all of last fiscal year. Individual income taxes increased 5.1% y/y following a 2.7% rise last year. The gain in social insurance receipts picked up to 5.9% y/y and excise taxes soared by almost one-third y/y.
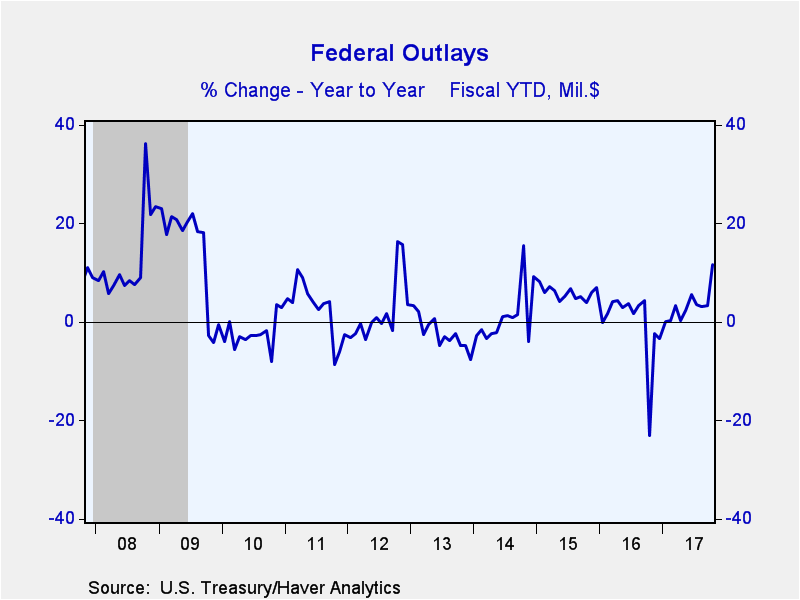
Government spending increased 11.6% y/y compared to 3.3% growth during all of FY'17. National defense spending rose 14.6% y/y after slight increases during the last two fiscal years. Health insurance spending improved 10.2% y/y following two years of single-digit growth, while Medicare outlays improved 7.7% y/y after little change last year. Income security payments strengthened 5.3% y/y after the FY17 decline; and Social Security payments increased a steady 3.0% y/y.
Haver's data on Federal Government outlays and receipts are contained in USECON. Considerable detail is given in the separate GOVFIN database. The Action Economics Forecast Survey numbers are in the AS1REPNA database.
| United States Government Finance | Oct FY'18 | FY'17 | FY'16 | FY'15 | FY'14 | FY'13 | |
|---|---|---|---|---|---|---|---|
| Budget Balance (Billions) | -- | $-63.2 | $-665.7 | $-585.6 | $-439.1 | $-483.4 | $-680.2 |
| As a percent of GDP | -- | -- | 3.5% | 3.2% | 2.5% | 2.8% | 4.1% |
| % of Total | |||||||
| Net Revenues (Fiscal Year YTD 2017, Y/Y % Change) | 100 | 6.2% | 1.5% | 0.6% | 7.6% | 8.9% | 13.3% |
| Individual Income Taxes | 47 | 5.1 | 2.7 | 0.3 | 10.5 | 5.9 | 16.3 |
| Corporate Income Taxes | 9 | 63.8 | -0.8 | -12.9 | 7.2 | 17.3 | 12.9 |
| Social Insurance Taxes | 34 | 5.9 | 4.2 | 4.7 | 4.1 | 8.0 | 12.1 |
| Excise Taxes | 3 | 30.8 | -11.8 | -3.3 | 5.3 | 11.1 | 6.3 |
| Net Outlays (Fiscal Year 2017 YTD, Y/Y % Change) | 100 | 11.6 | 3.3 | 4.5 | 5.3 | 1.4 | -2.4 |
| National Defense | 15 | 14.6 | 0.8 | 0.7 | -2.3 | -4.7 | -6.3 |
| Health | 15 | 10.2 | 4.1 | 6.2 | 17.8 | 14.3 | 3.3 |
| Medicare | 15 | 7.7 | 0.6 | 8.7 | 6.7 | 2.8 | 5.5 |
| Income Security | 13 | 5.3 | -2.1 | 1.0 | -0.9 | -4.3 | -1.1 |
| Social Security | 24 | 3.0 | 3.1 | 3.2 | 4.4 | 4.5 | 5.2 |
| Veterans Benefits & Services | 4 | 12.4 | 1.2 | 9.3 | 6.8 | 7.7 | 11.5 |
| Education, Training, Employment & Social Services | 4 | 82.6 | 31.6 | -10.2 | 34.7 | 25.9 | -21.9 |
| Interest | 7 | 21.7 | 9.2 | 7.8 | -1.8 | 2.8 | 0.4 |
Tom Moeller
AuthorMore in Author Profile »Prior to joining Haver Analytics in 2000, Mr. Moeller worked as the Economist at Chancellor Capital Management from 1985 to 1999. There, he developed comprehensive economic forecasts and interpreted economic data for equity and fixed income portfolio managers. Also at Chancellor, Mr. Moeller worked as an equity analyst and was responsible for researching and rating companies in the economically sensitive automobile and housing industries for investment in Chancellor’s equity portfolio. Prior to joining Chancellor, Mr. Moeller was an Economist at Citibank from 1979 to 1984. He also analyzed pricing behavior in the metals industry for the Council on Wage and Price Stability in Washington, D.C. In 1999, Mr. Moeller received the award for most accurate forecast from the Forecasters' Club of New York. From 1990 to 1992 he was President of the New York Association for Business Economists. Mr. Moeller earned an M.B.A. in Finance from Fordham University, where he graduated in 1987. He holds a Bachelor of Arts in Economics from George Washington University.


