 Global| Sep 19 2007
U.S. Housing Starts Fall Yet Again
Summary
Housing starts fell in August by 2.6% to 1.331M units. This result undershot Consensus expectations, which called for a decrease to 1.35M starts. July volume was revised from 1.38M to 1.367M.The August number was the smallest since [...]
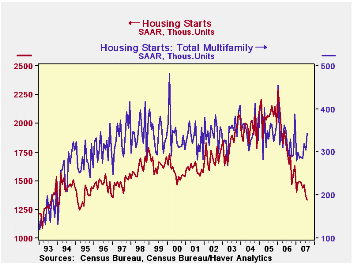
Housing starts fell in August by 2.6% to 1.331M units. This result undershot Consensus expectations, which called for a decrease to 1.35M starts. July volume was revised from 1.38M to 1.367M.The August number was the smallest since May 1995.
Single-family starts declined 7.1% to 988,000 units. This pace is the first under 1.0M since March 1995 and the lowest since March 1993.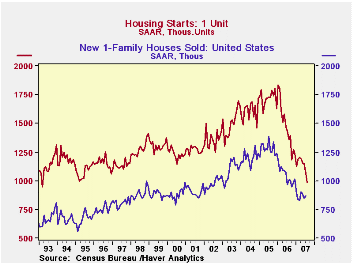
Single-family starts again fell in every region of the country in August. They were down 19.6% in the Northeast to just 74,000 (-37.7% y/y). In the West, they also had a big drop, 18.1% from July to 213,000 (-32.4% y/y). There is, though, a hint of stabilizing in the Midwest with "just" a 3.4% decrease to 172,000 (-14.4% y/y) and a mere 0.8% in the South to 529,000 (-26.6% y/y).
Starts of multi-family structures offset some of the weakness with a 12.8% increase to 343,000; July however was revised to 304,000 from the 311,000 reported last month. The August gain took place in the South, +77,000 in August and in the Midwest, +16.000; the Northeast saw a decline of 40,000, the West by 14,000.
Building permits were also weak, falling 5.9% m/m to 1.307M, their lowest level since March 1995. Permits to build a single-family home plunged 8.1% to just 926,000, their lowest since April 1995.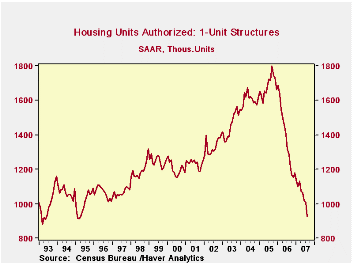
The Federal Reserve Board in one of its periodic "Bulletin" articles, presents the 2006 Home Mortgage Disclosure Act (HMDA) Data. This article, which emphasizes the cross-tabulation by county of home prices and serious mortgage delinquencies, can be found here.
| Housing Starts (000s, AR) | Aug | July | June | Y/Y | 2006 | 2005 | 2004 |
|---|---|---|---|---|---|---|---|
| Total | 1,331 | 1,367 | 1,468 | -19.1% | 1,812 | 2,073 | 1,950 |
| Single-Family | 988 | 1,063 | 1,147 | -27.1% | 1,474 | 1,719 | 1,604 |
| Multi-Family | 343 | 304 | 321 | +17.9% | 338 | 354 | 345 |
| Building Permits | 1,307 | 1,389 | 1,413 | -24.5% | 1,842 | 2,159 | 2,058 |
by Robert Brusca September 19, 2007
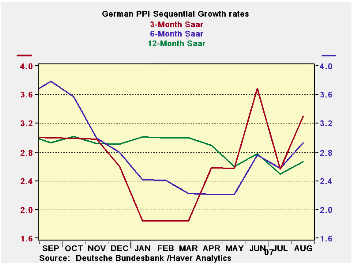
Year-over-year German inflation is lower. But over six months and six months pressures are back in August. The small seeming 0.4% rise in August is enough to boost the three-month growth rate and the six-month rate. Currently, the configuration is showing classical inflation acceleration as the 3-month inflation pace exceeds the six- month pace which in turn exceeds the Yr/Yr pace. June had seemed to bring inflation trends to a head in Germany, then in July pressures backed off. Now in August they seem to be back.
| %m/m | |||||||
| Aug-07 | Jul-07 | Jun-07 | 3-mo SAAR | 6-mo SAAR | 12-mo | 12-moY-Ago | |
| MFG | 0.2% | -0.1% | 0.3% | 1.4% | 1.9% | 1.0% | 5.9% |
| Ex Energy | 0.4% | 0.1% | 0.4% | 3.3% | 2.9% | 2.7% | 3.0% |
| 7COLSPAN | |||||||
by Robert Brusca September 19, 2007
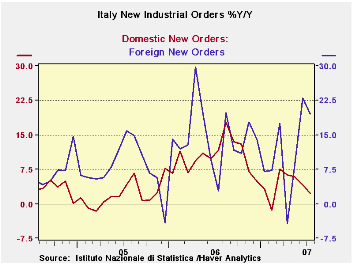
Euro-zone orders have begun to get choppy with weakness seen in foreign German orders in July and now a M/M drop in Italy’s foreign orders. AND while some of the MFG surveys are off peak, most industrial readings still stand at good solid levels. This month, despite some volatility the same is true for Italy.
Still, Italy’s foreign orders are strong, since orders had risen by more in June. The annualized three-month growth rate is 52.7%. Domestic orders that were up by a strong-seeming 1.3% in July are the ones that are slowing over three months with an annualized growth rate of 5.4%. That is still not a weak figure. Overall sales are up at a 14% pace in the three months ending in July.
In the third quarter, these figures imply growth of 26.9% in foreign orders and of 6.2% in domestic orders. Sales in Q3 are up at a 7.7% pace. So far this is a good start. But orders can be volatile. There have been other signs in the Euro area that have pointed to slowing, including MFG survey and orders and industrial production reports of other EU nations. Italy’s industrial figures at this point, while showing volatility, are not showing weakness.
| SAAR ex M/M | Jul-07 | Jun-07 | May-07 | 3-mo SAAR | 6-mo SAAR | 12-mo |
| Total | -0.4% | 2.5% | 2.5% | 20.3% | 19.5% | 7.9% |
| Foreign | -3.4% | 9.2% | 5.4% | 52.7% | 34.3% | 19.6% |
| Domestic | 1.3% | -1.0% | 1.0.% | 5.4% | 11.8% | 2.2% |
| Memo: | ||||||
| Sales | 1.2% | -1.9% | 4.1% | 14.0% | 8.0% | 8.3% |
| 7COLSPAN |
by Carol Stone September 19, 2007
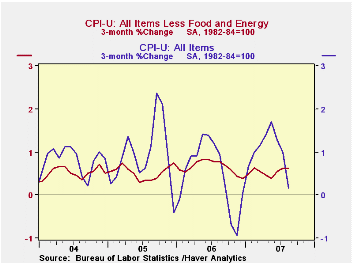
The consumer price index (CPI-U) edged down 0.1% in August, a bit softer than the Consensus forecast for unchanged. The 0.2% rise in prices less food & energy was in line with expectations. Actually, carried out to more decimal precision, the core rate was 0.15% in August, compared with 0.24% in July, so slower by almost 0.1%.
The year-to-year gain in core consumer prices of 2.1% was its slowest since March 2006.
Core goods prices were flat on the month. July's 0.4% rise in apparel prices was reversed with a 0.4% decrease in August, producing a year/year decline of 1.5%; men's clothes and footwear had the largest declines, while women's clothes were down slightly and children's were up 0.3%. Among other major consumer items, vehicle prices were up 0.26%, with new vehicles higher by just 0.07% but used vehicles remain strong at 0.82%. Household furnishings were down 0.18%, almost the same as in July.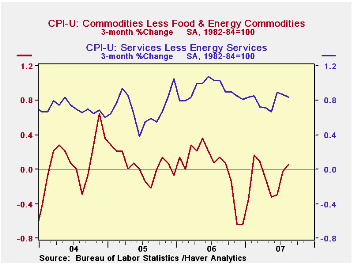
Core services prices rose 0.2% (3.2% y/y) following four consecutive months at 0.3%. Shelter prices rose just 0.15% (3.5% y/y) after July's 0.23%; owners' equivalent rent rose 0.23% (3.0% y/y) following July's 0.17%, but hotel rates -- lodging away from home -- fell 0.6% after July's 0.8% increase. Medical care services prices eased to a 0.5% increase (5.5% y/y) from 0.6% in July. Public transportation prices returned to their usual uptrend with a 0.5% rise; airfares were responsible for both a decline in July and August's pickup. Education service costs, including child care, rose 0.4%; most regular school fees slowed somewhat, but trade and technical school costs accelerated. Communications prices increased 0.1% (-0.8% y/y). Recreation goods and services fell 0.1% in August, putting the year/year change also at -0.1%; this is the first year-to-year decrease in this sub-index in its near-15-year history.
Energy prices fell 3.2% (-2.6% y/y) due to the 4.9% drop in gasoline prices (-6.4% y/y). Fuel oil prices stabilized with a 0.2% increase (0.5% y/y) after July's 3.4% jump, but natural gas & electricity prices fell 1.3% (+2.3% y/y).
Food & beverage prices rose 0.4% (4.2% y/y) as prices for meats, poultry & fish edged higher by 0.1% (5.4% y/y) following their decline in July. Dairy product prices remain very strong, up 1.7% in the month after July's 2.7%; these and previous advances put the year/year rate at 12.1%.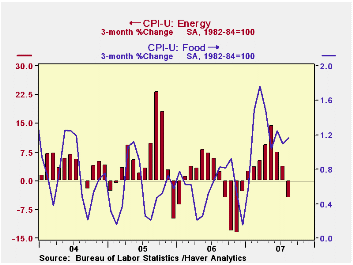
The chained CPI, which adjusts for shifts in the mix of consumer purchases, fell 0.1% (+1.8% y/y) for a second month; the core figure rose 0.2%, but its year/year increase slowed to 1.7% from 1.8% in the previous month.
| Consumer Price Index | Aug | July | June | Y/Y | 2006 | 2005 | 2004 |
|---|---|---|---|---|---|---|---|
| Total | -0.1% | 0.1% | 0.2% | 2.4% | 3.2% | 3.4% | 2.7% |
| Total less Food & Energy | 0.2% | 0.2% | 0.2% | 2.2% | 2.5% | 2.2% | 1.8% |
| Goods less Food & Energy | 0.0% | 0.1% | -0.1% | -0.6% | 0.2% | 0.5% | -0.9% |
| Services less Energy | 0.2% | 0.3% | 0.3% | 3.2% | 3.4% | 2.8% | 2.8% |
| Energy | -3.2% | -1.0% | -0.5% | 1.0% | 11.1% | 16.9% | 10.8% |
| Food & Beverages | 0.4% | 0.3% | 0.5% | 4.2% | 2.3% | 2.4% | 3.4% |
| Chained CPI: Total (NSA) | -0.1% | -0.1% | 0.2% | 2.1% | 2.8% | 2.9% | 2.5% |
| Total less Food & Energy | 0.2% | 0.0% | 0.0% | 1.8% | 2.3% | 1.9% | 1.7% |
Carol Stone, CBE
AuthorMore in Author Profile »Carol Stone, CBE came to Haver Analytics in 2003 following more than 35 years as a financial market economist at major Wall Street financial institutions, most especially Merrill Lynch and Nomura Securities. She had broad experience in analysis and forecasting of flow-of-funds accounts, the federal budget and Federal Reserve operations. At Nomura Securities, among other duties, she developed various indicator forecasting tools and edited a daily global publication produced in London and New York for readers in Tokyo. At Haver Analytics, Carol was a member of the Research Department, aiding database managers with research and documentation efforts, as well as posting commentary on select economic reports. In addition, she conducted Ways-of-the-World, a blog on economic issues for an Episcopal-Church-affiliated website, The Geranium Farm. During her career, Carol served as an officer of the Money Marketeers and the Downtown Economists Club. She had a PhD from NYU's Stern School of Business. She lived in Brooklyn, New York, and had a weekend home on Long Island.
More Economy in Brief
 Global| Feb 05 2026
Charts of the Week: Balanced Policy, Resilient Data and AI Narratives
by:Andrew Cates


