 Global| Sep 12 2012
U.S. Import Prices Turn Higher on Petroleum
Summary
U.S. import prices rose 0.7% in August, the first monthly increase since March, driven by a 4.1% surge in petroleum. July's total decreased 0.7%, revised from -0.6% reported initially. The August total was actually somewhat lower than [...]
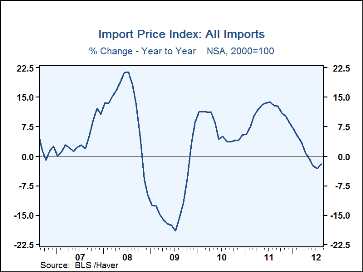
U.S. import prices rose 0.7% in August, the first monthly increase since March, driven by a 4.1% surge in petroleum. July's total decreased 0.7%, revised from -0.6% reported initially. The August total was actually somewhat lower than economists had forecast, with the Action Economics consensus survey calling for a 1.3% increase.
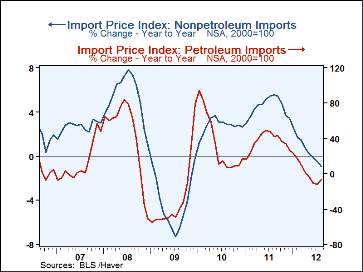
Import prices continued lower in most nonpetroleum categories, with that subtotal down 0.2% following a 0.3% decline in July. Food and beverages were off 0.9% after a 1.0% drop in July. Most nonoil industrial supply prices fell, but there were gains in nonoil fuels and some building materials so that category only edged down 0.1% after July's sharp 1.3% fall. Capital goods prices eased 0.1% and July was revised from -0.1% originally to flat overall in August. Automotive vehicles were also flat in August after a 0.3% rise in July while other consumer goods imports fell 0.3% in price, after a 0.1% decrease in July.
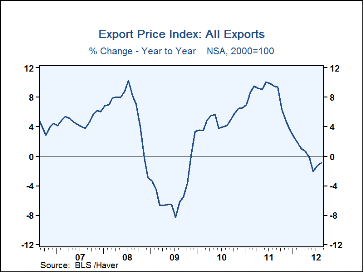
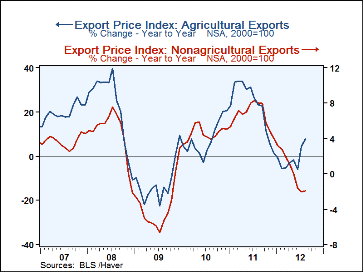
U.S. export prices were up 0.9%, led by agricultural items, which surged 5.1% following their strong 6.3% gain in July. Nonagricultural commodity prices rose 0.4%, an upturn after three consecutive declines. Food items were important here too, as processed foods and industrial agriculture-related items both gained roundly 5% in August. Capital goods export prices and automotive both declined in August by 0.2%, and consumer goods exports were flat. Total export prices were still down from a year ago, by 0.9%.
The import and export price series can be found in Haver's USECON database. Detailed figures are available in the USINT database. The expectations figure is in the AS1REPNA database.
| Import/Export Prices (NSA, %) | Aug | Jul | Jun | Aug Y/Y | 2011 | 2010 | 2009 |
|---|---|---|---|---|---|---|---|
| Imports - All Commodities | 0.7 | -0.7 | -2.3 | -2.2 | 10.9 | 6.9 | -11.5 |
| Petroleum | 4.1 | -2.1 | -8.7 | -6.4 | 36.5 | 28.4 | -35.9 |
| Nonpetroleum | -0.2 | -0.3 | -0.3 | -0.9 | 4.5 | 2.8 | -4.1 |
| Exports - All Commodities | 0.9 | 0.4 | -1.7 | -0.9 | 8.1 | 4.9 | -4.6 |
| Agricultural | 5.1 | 6.3 | -3.5 | 7.7 | 22.3 | 7.9 | -12.8 |
| Nonagricultural | 0.4 | -0.3 | -1.5 | -1.9 | 6.6 | 4.6 | -3.7 |
Carol Stone, CBE
AuthorMore in Author Profile »Carol Stone, CBE came to Haver Analytics in 2003 following more than 35 years as a financial market economist at major Wall Street financial institutions, most especially Merrill Lynch and Nomura Securities. She has broad experience in analysis and forecasting of flow-of-funds accounts, the federal budget and Federal Reserve operations. At Nomura Securites, among other duties, she developed various indicator forecasting tools and edited a daily global publication produced in London and New York for readers in Tokyo. At Haver Analytics, Carol is a member of the Research Department, aiding database managers with research and documentation efforts, as well as posting commentary on select economic reports. In addition, she conducts Ways-of-the-World, a blog on economic issues for an Episcopal-Church-affiliated website, The Geranium Farm. During her career, Carol served as an officer of the Money Marketeers and the Downtown Economists Club. She has a PhD from NYU's Stern School of Business. She lives in Brooklyn, New York, and has a weekend home on Long Island.


