 Global| Jan 15 2021
U.S. Industrial Production Continues Recovery
Summary
• Production up 1.6% with widespread gains. • Durable goods up 1%, despite fall in motor vehicle output. • Capacity utilization has biggest gain since July. Industrial production advanced 1.6% in December, following an 0.5% increase [...]
• Production up 1.6% with widespread gains.
• Durable goods up 1%, despite fall in motor vehicle output.
• Capacity utilization has biggest gain since July.
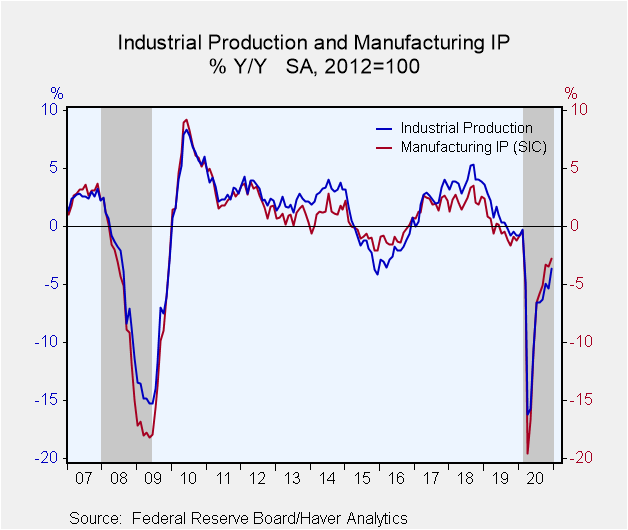
Industrial production advanced 1.6% in December, following an 0.5% increase in November; that was marginally revised from 0.4%. Several sectors contributed to the December gain, but the main move was a 6.2% increase in utility output, which bounced back from a 4.5% drop in November. The Action Economics survey had expected a 0.5% rise in overall industrial production in December. For 2020 as a whole, industrial production fell 6.8% and December was 3.6% below December 2019.
As noted, several sectors showed increases in December, and manufacturing gained 0.9%, slightly more than its 0.8% rise in November. Even so, factory output remains 2.8% below a year ago and for all of 2020, it was down 6.7%. Indeed, the index level for 2020 was 97.9, indicating that manufacturing production is even below the 2012=100 base period. Otherwise, besides the gain in utility output in December, mining output rose 1.6% after a 2.8% increase in November. It was also down double-digits for all of 2020, at -10.3%
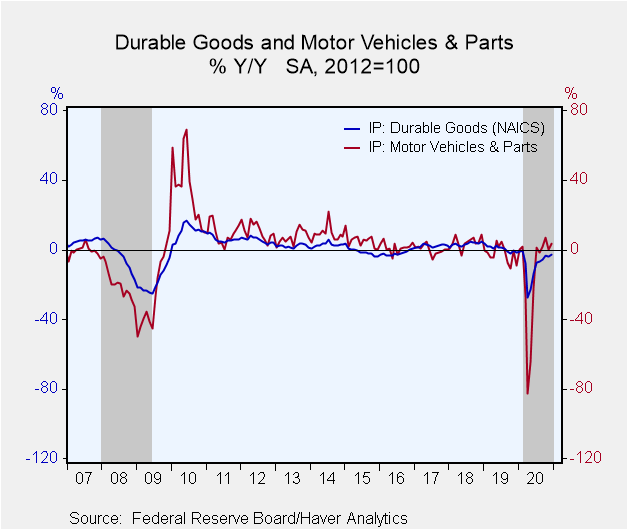
Durable goods production increased 1.0% last month (-3.0% y/y). Of individual industries, only motor vehicles and computers fell, those by 1.6% (+3.6% y/y) and 0.6% (+0.1% y/y), respectively. And while motor vehicle output was down in December, it had risen 5.0% in November. Among other industries, machinery output recovered 2.1% (-3.8% y/y) after a 1.0% decrease in November. Electrical equipment and appliance production was up 1.8% (-1.7% y/y) after a marginal 0.1% rise the previous month.
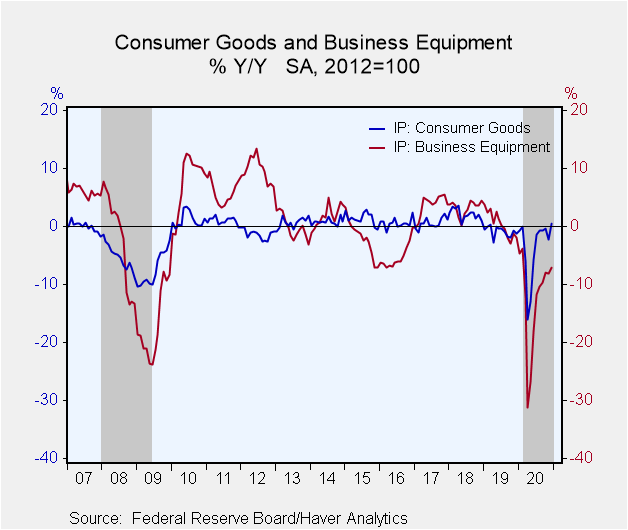
Nondurable goods production rose 0.9% (-2.2% y/y) last month, strengthening from its 0.1% increase in November. Production of food, beverages and tobacco was unchanged (+0.4% y/y) and printing was down 1.4% (-10.4% y/y). All other sectors increased noticeably, especially plastics by 3.2% (-0.7% y/y), textiles by 1.8% (-5.0% y/y), petroleum by 1.5% (-13.3% y/y), and chemicals 1.1% (-1.3% y/y).
Output of selected high technology equipment rose 0.8% (5.1% y/y) after a 0.3% rise. Excluding these products, overall production expanded 1.6% (-3.8% y/y). Excluding both high tech products & motor vehicles, factory production rose 1.8% (-4.2% y/y).
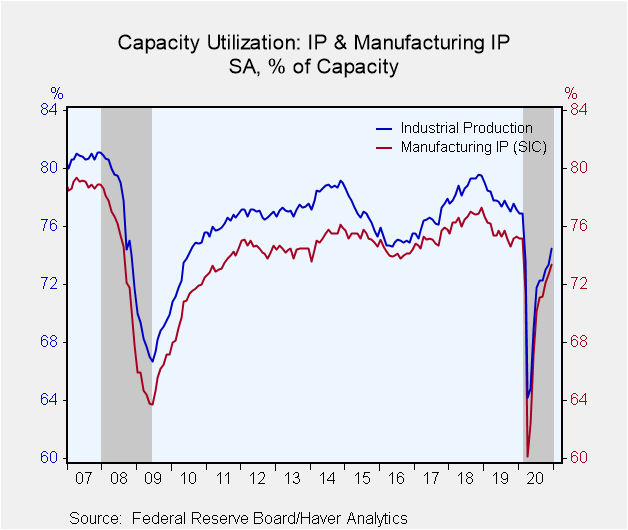
Capacity utilization improved to 74.5%, up from 73.4% in November; the December amount is the largest since February's 76.9% and the largest monthly increase since July. Factory sector utilization rose to 73.4%, its highest point since February and up from the April low of 60.1%.
Industrial production and capacity are located in Haver's USECON database. Additional detail on production and capacity can be found in the IP database. The expectations figures come from the AS1REPNA database.
| Industrial Production (SA, % Change) | Dec | Nov | Oct | Dec Y/Y | 2020 | 2019 | 2018 |
|---|---|---|---|---|---|---|---|
| Total Output | 1.6 | 0.5 | 1.0 | -3.6 | -6.8 | 0.9 | 4.0 |
| Manufacturing | 0.9 | 0.8 | 1.3 | -2.8 | -6.7 | -0.2 | 2.3 |
| Durable Goods | 1.0 | 1.5 | 1.2 | -3.0 | -8.7 | 0.7 | 3.4 |
| Motor Vehicles | -1.6 | 5.0 | -0.7 | 3.6 | -15.2 | -2.3 | 4.1 |
| Selected High Tech | 0.8 | 0.3 | 1.9 | 5.1 | 4.3 | 5.1 | 6.4 |
| Nondurable Goods | 0.9 | 0.1 | 1.5 | -2.2 | -4.2 | -0.7 | 1.9 |
| Utilities | 6.2 | -4.5 | 2.1 | 2.7 | -2.7 | -0.8 | 4.4 |
| Mining | 1.6 | 2.8 | -1.7 | -12.3 | -10.3 | 7.1 | 12.4 |
| Capacity Utilization (%) | 74.5 | 73.4 | 73.0 | 77.2 | 71.9 | 77.8 | 78.7 |
| Manufacturing | 73.4 | 72.7 | 72.1 | 75.3 | 70.2 | 75.6 | 76.6 |
Carol Stone, CBE
AuthorMore in Author Profile »Carol Stone, CBE came to Haver Analytics in 2003 following more than 35 years as a financial market economist at major Wall Street financial institutions, most especially Merrill Lynch and Nomura Securities. She had broad experience in analysis and forecasting of flow-of-funds accounts, the federal budget and Federal Reserve operations. At Nomura Securities, among other duties, she developed various indicator forecasting tools and edited a daily global publication produced in London and New York for readers in Tokyo. At Haver Analytics, Carol was a member of the Research Department, aiding database managers with research and documentation efforts, as well as posting commentary on select economic reports. In addition, she conducted Ways-of-the-World, a blog on economic issues for an Episcopal-Church-affiliated website, The Geranium Farm. During her career, Carol served as an officer of the Money Marketeers and the Downtown Economists Club. She had a PhD from NYU's Stern School of Business. She lived in Brooklyn, New York, and had a weekend home on Long Island.
More Economy in Brief
 Global| Feb 05 2026
Charts of the Week: Balanced Policy, Resilient Data and AI Narratives
by:Andrew Cates


