 Global| Jun 15 2021
U.S. Industrial Production Has Broad Gains in May
Summary
• Industrial production gained 0.8% m/m, with manufacturing output up 0.9%. • Motor vehicle production rebounded 6.7%. • Capacity utilization highest since February 2020, before the pandemic. Industrial production rose 0.8% m/m (16.3% [...]
• Industrial production gained 0.8% m/m, with manufacturing output up 0.9%.
• Motor vehicle production rebounded 6.7%.
• Capacity utilization highest since February 2020, before the pandemic.
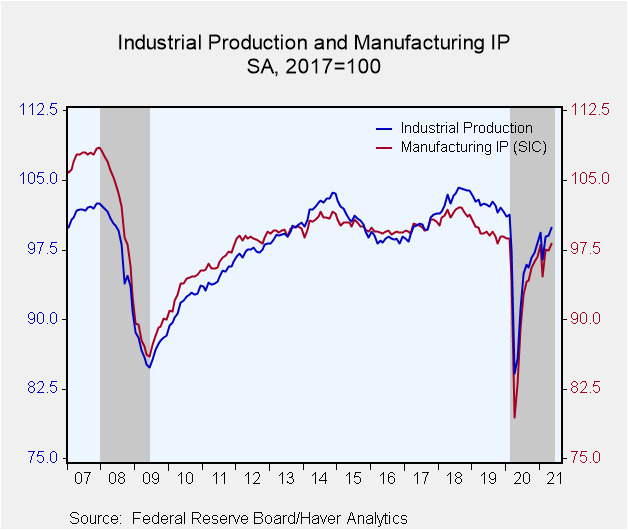
Industrial production rose 0.8% m/m (16.3% y/y) in May, following a downwardly revised 0.1% m/m (17.6% y/y) rise in April (initially 0.7% m/m). April 2020 was the trough of the pandemic, hence the large year-on-year rise. That said, total industrial production was still 1.4% below its pre-pandemic (February 2020) level. The Action Economics Forecast Survey looked for a rise of 0.6% m/m in May.
This report is the first following annual revisions in the industrial production dataset, which the Federal Reserve published on May 28. The Fed also updated the base period from 2012=100 to 2017=100. Thus, the May index is 99.9, up from 99.0 in April. April was reported last month at 106.3 on the base of 2012=100.
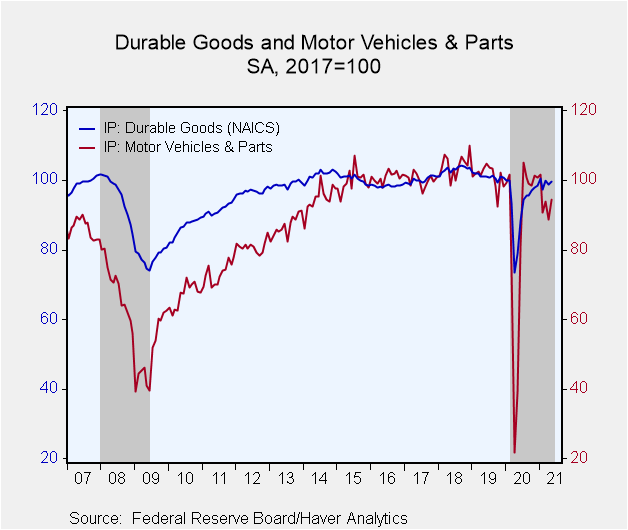
The index for manufacturing rose 0.9% m/m (18.3% y/y) in May, following a decrease of 0.1% in April. Motor vehicles rebounded 6.7% m/m after a 5.6% drop in April that reflected the shortages of semiconductors. Excluding the motor vehicle sector, factory output rose 0.5% m/m in May and 0.3% in April. Mining rose 1.1% m/m (16.4% y/y), following a 0.4% m/m decrease in April. Utilities output rose 0.2% m/m (3.7% y/y), following 1.9% m/m in April. The rise reflected a decrease of 0.4% m/m (5.6% y/y) in electric power generation, transmission and distribution, and a 3.9% m/m advance (-7.7% y/y) in natural gas distribution.
Durable goods manufacturing output advanced 1.0% (26.1% y/y) in May after falling 1.2% in April. This swing reflects the swing in motor vehicle production. Other durable goods output edged up just 0.1% in May (17.1% y/y) after declining 0.5% m/m in April. The output of those industries was fairly mixed, as, for instance, computer and electronic equipment rose 1.5% (13.0% y/y) while electrical equipment fell 0.6% (+12.3% y/y).
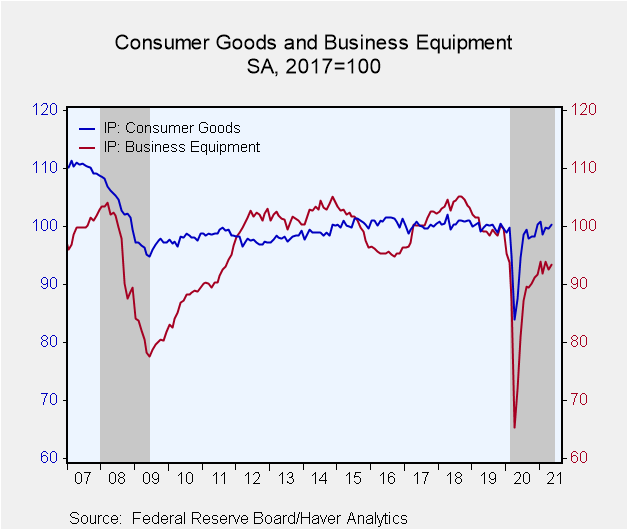
Nondurable goods output rose 0.8% m/m (10.6% y/y) in May, following 1.0% m/m in April. Apparel and leather goods output jumped 2.6% (31.7% y/y) after 1.3% in April. Chemicals were up 2.2% (8.2% y/y) after 4.3%. Printing and related activities advanced 3.3% (21.2% y/y) in May but paper fell 1.6% (4.4% y/y). Other nondurable goods had more modest moves or were actually flat in the month.
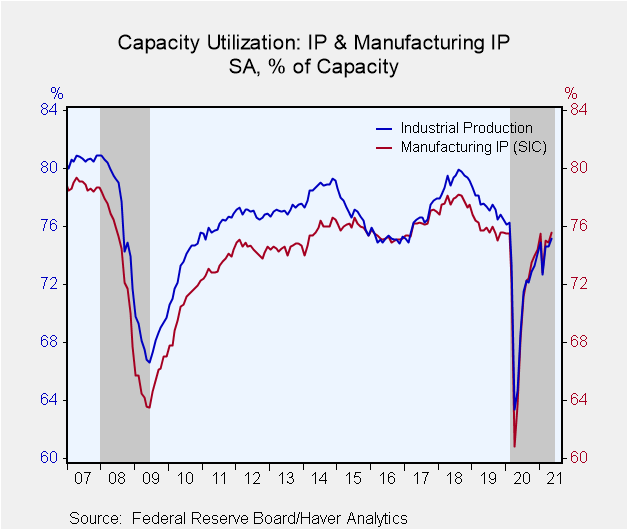
Capacity utilization was 75.2 percent in May, up from 74.6 percent in April and the highest since 76.3 in February 2020, just before the pandemic struck. In manufacturing, it was 75.6 percent up from 74.9 in April.
Industrial production and capacity are located in Haver's USECON database. Additional detail on production and capacity utilization can be found in the IP database. The expectations figures come from the AS1REPNA database.
| Industrial Production (SA, % Change) | May | Apr | Mar | May Y/Y | 2020 | 2019 | 2018 |
|---|---|---|---|---|---|---|---|
| Total Output | 0.8 | 0.1 | 2.6 | 16.3 | -7.2 | -0.8 | 3.2 |
| Manufacturing | 0.9 | -0.1 | 3.1 | 18.3 | -6.6 | -2.0 | 1.3 |
| Durable Goods | 1.0 | -1.2 | 2.5 | 26.0 | -8.2 | -2.1 | 3.1 |
| Motor Vehicles | 6.7 | -5.7 | 3.6 | 140.8 | -15.7 | -3.0 | 4.1 |
| Selected High Tech | 1.5 | 1.4 | 2.2 | 18.1 | 7.1 | 3.9 | 9.0 |
| Nondurable Goods | 0.8 | 1.1 | 3.8 | 10.7 | -4.4 | -1.8 | -0.3 |
| Utilities | 0.2 | 1.9 | -8.8 | 3.6 | -3.4 | -0.8 | 4.9 |
| Mining | 1.2 | -0.4 | 11.9 | 16.5 | -14.2 | 5.9 | 13.0 |
| Capacity Utilization (%) | 75.2 | 74.6 | 74.6 | 64.7 | 71.6 | 77.4 | 79.2 |
| Manufacturing | 75.6 | 74.9 | 75.0 | 63.7 | 71.2 | 75.8 | 77.7 |
Carol Stone, CBE
AuthorMore in Author Profile »Carol Stone, CBE came to Haver Analytics in 2003 following more than 35 years as a financial market economist at major Wall Street financial institutions, most especially Merrill Lynch and Nomura Securities. She had broad experience in analysis and forecasting of flow-of-funds accounts, the federal budget and Federal Reserve operations. At Nomura Securities, among other duties, she developed various indicator forecasting tools and edited a daily global publication produced in London and New York for readers in Tokyo. At Haver Analytics, Carol was a member of the Research Department, aiding database managers with research and documentation efforts, as well as posting commentary on select economic reports. In addition, she conducted Ways-of-the-World, a blog on economic issues for an Episcopal-Church-affiliated website, The Geranium Farm. During her career, Carol served as an officer of the Money Marketeers and the Downtown Economists Club. She had a PhD from NYU's Stern School of Business. She lived in Brooklyn, New York, and had a weekend home on Long Island.
More Economy in Brief
 Global| Feb 05 2026
Charts of the Week: Balanced Policy, Resilient Data and AI Narratives
by:Andrew Cates


