 Global| May 14 2021
U.S. Industrial Production Rises Modestly in April
Summary
• Industrial production gained 0.7% m/m, with manufacturing output up 0.4%. • Shortage of semiconductors continues to affect vehicle production. • Chemical production rose 3.2%. Industrial production rose 0.7% m/m (16.5% y/y) in [...]
• Industrial production gained 0.7% m/m, with manufacturing output up 0.4%.
• Shortage of semiconductors continues to affect vehicle production.
• Chemical production rose 3.2%.
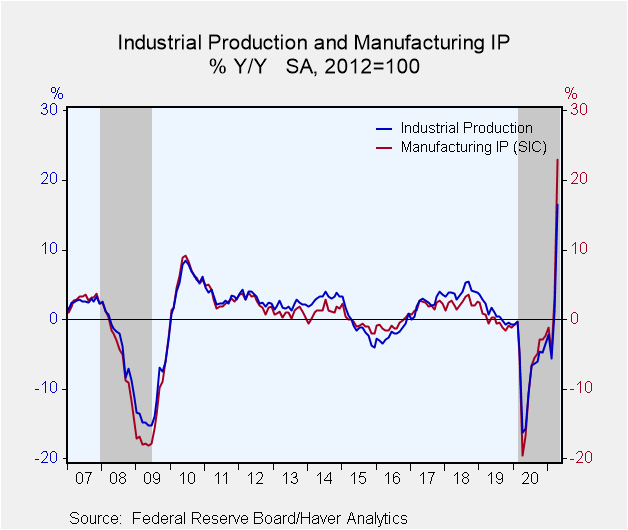
Industrial production rose 0.7% m/m (16.5% y/y) in April, following an upwardly revised 2.4% m/m (1.0% y/y) rise in March (initially 1.4% m/m) and a downwardly revised contraction in February of 3.5% (reported last month as -2.6% m/m). April 2020 was the trough of the pandemic, hence the large year-on-year rise. That said, total industrial production was still 2.7% below its pre-pandemic (February 2020) level. The Action Economics Forecast Survey looked for a rise of 1.1% m/m in April. The unusually cold weather in February had affected industrial production both in February and March. The return to operation of plants that were damaged by February's severe weather conditions in the south-central region contributed to the advance in factory output.
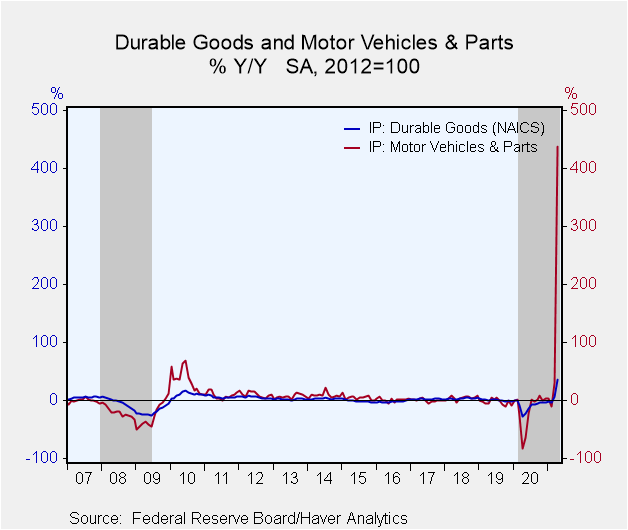
The index for manufacturing rose 0.4% m/m (23.0% y/y) in April, following a 3.1% rise in March despite a 4.3% m/m drop in motor vehicles and parts that continues to reflect shortages of semiconductors. Excluding the motor vehicle sector, factory output rose 0.7% m/m. Mining rose 0.7% m/m (-2.4% y/y), following the 8.9% m/m jump in March. Utilities output rose 2.6% m/m (1.9% y/y), following a 9% m/m plunge in March. The rise reflected a 2% m/m (4.1% y/y) gain in electric power generation, transmission and distribution, and a 6.1% m/m jump (-8.2% y/y) in natural gas.
Durable manufacturing output declined 0.4% m/m (36.6% y/y) in April, driven by the afore-mentioned decline in motor vehicles and parts. Durable goods output had posted a 3.2% m/m advance in March. Other categories of durables posted either small increases (computers and electronic products +0.3% m/m) or small declines (fabricated metal products -0.2% m/m).
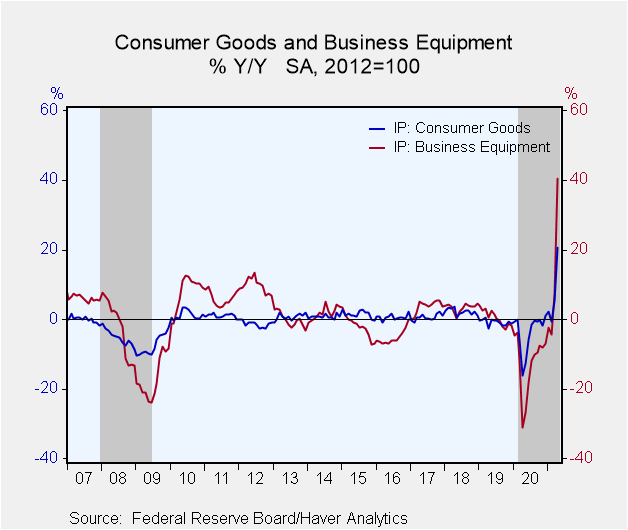
Nondurable products rose 1.3% m/m (11.7% y/y), following a rise of 3.2% m/m in March. Chemicals posted a 3.2% m/m gain, the largest in the nondurable category. Output of petroleum and coal products followed with a monthly gain of 1.6%, and apparel and leather goods with a gain of 0.7%. Other categories, such as paper, printing and support, and plastics and rubber products recorded small declines.
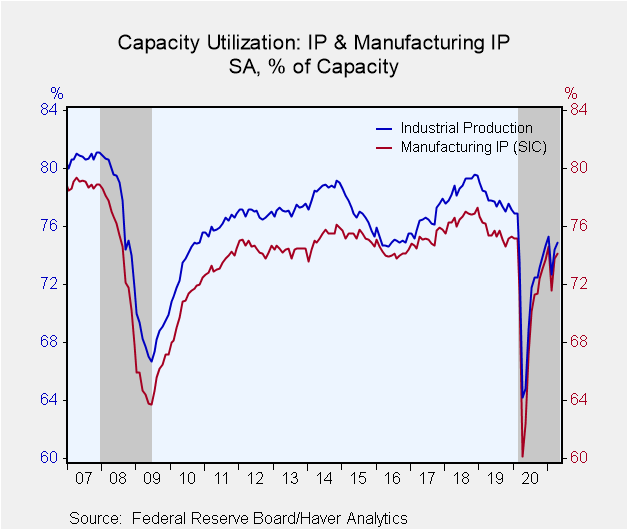
Capacity utilization rose 0.5 percentage point in April to 74.9 percent, a rate that is 4.7 percentage point below its long-run (1972-2020) average.
Industrial production and capacity are located in Haver's USECON database. Additional detail on production and capacity can be found in the IP database. The expectations figures come from the AS1REPNA database.
| Industrial Production (SA, % Change) | Apr | Mar | Feb | Apr Y/Y | 2020 | 2019 | 2018 |
|---|---|---|---|---|---|---|---|
| Total Output | 0.7 | 2.4 | -3.5 | 16.5 | -6.7 | 0.9 | 3.9 |
| Manufacturing | 0.4 | 3.1 | -4.0 | 23.0 | -6.5 | -0.2 | 2.3 |
| Durable Goods | -0.4 | 3.2 | -3.1 | 36.6 | -8.7 | 0.7 | 3.4 |
| Motor Vehicles | -4.3 | 3.8 | -9.9 | 439.7 | -15.1 | -2.4 | 4.1 |
| Selected High Tech | 0.4 | 2.2 | -0.2 | 10.8 | 4.3 | 5.1 | 6.4 |
| Nondurable Goods | 1.3 | 3.2 | -5.2 | 11.7 | -3.9 | -0.7 | 1.9 |
| Utilities | 2.6 | -9.0 | 7.8 | 1.9 | -2.7 | -0.8 | 4.4 |
| Mining | 0.7 | 8.9 | -9.5 | -2.4 | -10.2 | 7.1 | 12.4 |
| Capacity Utilization (%) | 74.9 | 74.4 | 72.7 | 64.2 | 72.0 | 77.8 | 78.7 |
| Manufacturing | 74.1 | 73.8 | 71.6 | 60.1 | 70.3 | 75.6 | 76.6 |
Kathleen Stephansen, CBE
AuthorMore in Author Profile »Kathleen Stephansen is a Senior Economist for Haver Analytics and an Independent Trustee for the EQAT/VIP/1290 Trust Funds, encompassing the US mutual funds sponsored by the Equitable Life Insurance Company. She is a former Chief Economist of Huawei Technologies USA, Senior Economic Advisor to the Boston Consulting Group, Chief Economist of the American International Group (AIG) and AIG Asset Management’s Senior Strategist and Global Head of Sovereign Research. Prior to joining AIG in 2010, Kathleen held various positions as Chief Economist or Head of Global Research at Aladdin Capital Holdings, Credit Suisse and Donaldson, Lufkin and Jenrette Securities Corporation.
Kathleen serves on the boards of the Global Interdependence Center (GIC), as Vice-Chair of the GIC College of Central Bankers, is the Treasurer for Economists for Peace and Security (EPS) and is a former board member of the National Association of Business Economics (NABE). She is a member of Chatham House and the Economic Club of New York. She holds an undergraduate degree in economics from the Universite Catholique de Louvain and graduate degrees in economics from the University of New Hampshire (MA) and the London School of Economics (PhD abd).
More Economy in Brief
 Global| Feb 05 2026
Charts of the Week: Balanced Policy, Resilient Data and AI Narratives
by:Andrew Cates


