 Global| Aug 17 2010
U.S. Industrial Production Rose 1.0% in July
Summary
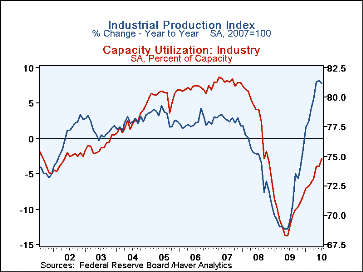
Industrial production surprised for July with a 1.0% surge, compared with a consensus expectation of 0.5% and a downward revised -0.1% in June. Output is up 7.7% from a year ago. The manufacturing sector gained 1.1% in the month, [...]
Industrial production surprised for July with a 1.0% surge, compared with a consensus expectation of 0.5% and a downward revised -0.1% in June. Output is up 7.7% from a year ago. The manufacturing sector gained 1.1% in the month, after a 0.5% decline in June and it too is up 7.7% from last July. Durable goods production had a sizable 2.1% gain after decreasing 0.5% in June, while nondurable goods edged up a mere 0.1% after a 0.7% drop. Utilities output, which had been the leader in June, stabilized in July, up just 0.1% after 2.3% that previous period and 5.9% in May.
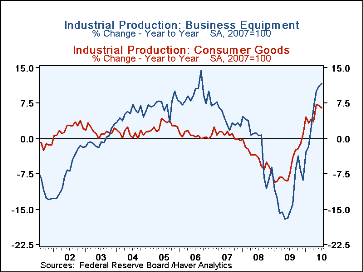
The performance of the durable goods industries was quite impressive. A change in auto industry summer schedules contributed to those plants leaping ahead 9.9% on the month, with a whopping 32.6% increase over July 2009. But this is not the only strong durable goods sector. As Tom Moeller pointed out here a month ago, business equipment has been a leader and it continued so in July. Output of computers and machinery each rose 1.1%, and the requisite fabricated metals and nonmetallic mineral products both gained markedly, 1.5% and 3.4%, respectively. Aerospace and other transport equipment was up 1.7%. Among other durable goods, miscellaneous was up 1.3% and – despite the hesitation in the housing industry – furniture output continued to increase, picking up 0.6% in a sixth consecutive monthly rise. Some nondurable goods industries did show gains, most notably textiles, petroleum and chemicals.
Capacity utilization advanced to 74.8% from 74.1% in June; this compares to 69.1% in July 2009 and is the highest since 75.4% in October 2008.
Surely, this report is encouraging. It, along with recent GDP data, indicates that capital goods output and investment seem to be leading any strength in the U.S. economy. This sector, of course, generally strengthens after other demand has increased, so these developments bear continuing exploration. Industrial production and capacity data are included in Haver's USECON database, with additional detail in the IP database.
| Industrial Production(SA, % Change) | July | June | May | Year Ago | 2009 | 2008 | 2007 |
|---|---|---|---|---|---|---|---|
| Total Output | 1.0 | -0.1 | 1.3 | 7.7 | -9.3 | -3.3 | 2.7 |
| Manufacturing | 1.1 | -0.5 | 1.1 | 7.7 | -11.1 | -4.5 | 2.9 |
| Consumer Goods | 1.1 | -0.6 | 2.5 | 6.4 | -5.8 | -4.2 | 0.9 |
| Business Equipment | 1.8 | 0.5 | 1.4 | 11.7 | -12.2 | -1.5 | 4.5 |
| Construction Supplies | 0.5 | -0.1 | 0.0 | 5.5 | -16.7 | -9.5 | -1.2 |
| Materials | 0.9 | 0.3 | 0.8 | 8.7 | -9.7 | -2.7 | 3.7 |
| Utilities | 0.1 | 2.3 | 5.9 | 8.2 | -2.6 | -0.1 | 3.4 |
| Capacity Utilization (%) | 74.8 | 74.1 | 74.1 | 69.1 | 70.0 | 77.9 | 81.3 |
| Manufacturing | 72.2 | 71.4 | 71.7 | 66.6 | 67.2 | 75.0 | 79.6 |
Carol Stone, CBE
AuthorMore in Author Profile »Carol Stone, CBE came to Haver Analytics in 2003 following more than 35 years as a financial market economist at major Wall Street financial institutions, most especially Merrill Lynch and Nomura Securities. She had broad experience in analysis and forecasting of flow-of-funds accounts, the federal budget and Federal Reserve operations. At Nomura Securities, among other duties, she developed various indicator forecasting tools and edited a daily global publication produced in London and New York for readers in Tokyo. At Haver Analytics, Carol was a member of the Research Department, aiding database managers with research and documentation efforts, as well as posting commentary on select economic reports. In addition, she conducted Ways-of-the-World, a blog on economic issues for an Episcopal-Church-affiliated website, The Geranium Farm. During her career, Carol served as an officer of the Money Marketeers and the Downtown Economists Club. She had a PhD from NYU's Stern School of Business. She lived in Brooklyn, New York, and had a weekend home on Long Island.
More Economy in Brief
 Global| Feb 05 2026
Charts of the Week: Balanced Policy, Resilient Data and AI Narratives
by:Andrew Cates


