 Global| Apr 01 2021
U.S. Initial Claims Post a Rise in the Week Ending March 27
Summary
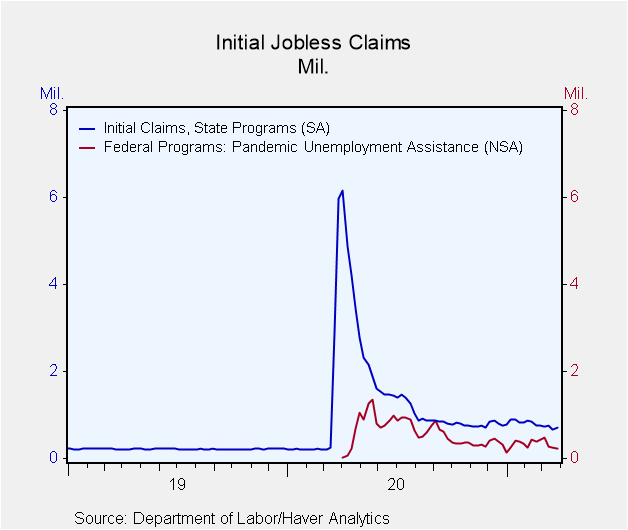
• PUA claims continue to decline. • Insured jobless rate is unchanged in the week ending March 20. Initial claims for unemployment insurance were 719,000, an increase of 61,000 from the previous week, which was revised down by 26,000 [...]
• PUA claims continue to decline.
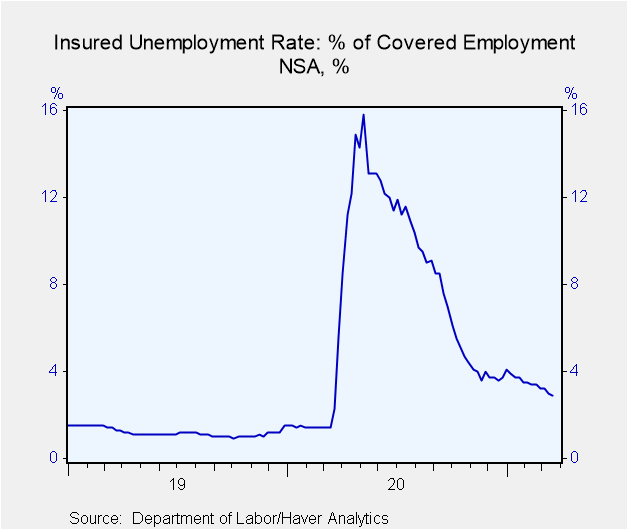
• Insured jobless rate is unchanged in the week ending March 20.
Initial claims for unemployment insurance were 719,000, an increase of 61,000 from the previous week, which was revised down by 26,000 from 684,000 to 658,000. The Action Economics Forecast Survey had expected 690,000 initial claims for the latest week. The 4-week moving average was 719,000, a decrease of 10,500 from the previous unrevised week and the lowest since March 14, 2020 when it was 225,000.
Initial claims for the federal Pandemic Unemployment Assistance (PUA) program were 237,025 for the week ending March 27, down from 241,137 the week prior. The PUA program covers individuals such as the self-employed who are not included in regular state unemployment insurance. Given the brief history of this program, which started April 4, 2020, these and other COVID-related series are not seasonally adjusted.
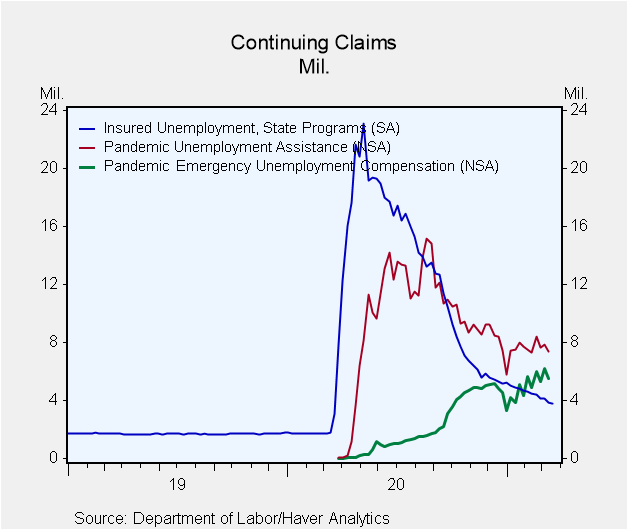
Continuing claims for regular state unemployment insurance fell by 46,000 in the week ending March 20, while the seasonally adjusted state insured rate of unemployment was 2.7% for that week, unchanged from the prior week's unrevised rate. Continuing PUA claims for the week of March fell 495,204 to 7.350 million in the week ending March 13.
The number of Pandemic Emergency Unemployment Compensation (PEUC) claims fell by 705,137 in the week ending March 13, to 5.515 million. That program covers people who were unemployed before COVID but exhausted their state benefits. An extension of the PEUC benefits was included in the American Rescue Plan bill passed by the Congress earlier this month, and they will now be available until August 29.
The total number of all state, federal and PUA and PEUC continuing claims fell by 1.518 million in the week of March 13, to reach 18.213 million. This grand total is not seasonally adjusted.
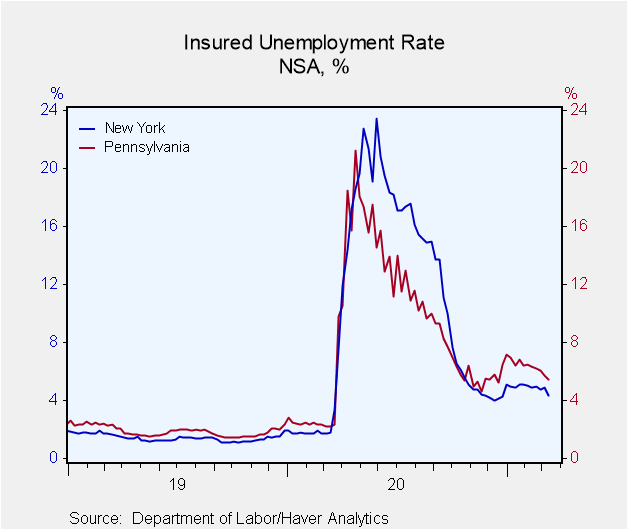
The state insured rates of unemployment continued to show wide variation. In the week ending March 13, the highest insured unemployment rates were in Pennsylvania (5.5%), Nevada (5.4%), Alaska (5.0%), Puerto Rico (4.9%), Connecticut (4.7%), New York (4.4%), and California (4.0%). The largest increases in initial claims for the week ending March 20 were in Massachusetts (+11,386), Texas (+7,599), and Connecticut (+4,170), while the largest decreases were in Illinois (-55,580), Ohio (-45,808), and California (-13,331).
The Department of Labor notes that "This week's release reflects the annual revision to the weekly unemployment claims seasonal adjustment factors. The seasonal adjustment factors used for the UI Weekly Claims data from 2016 forward, along with the resulting seasonally adjusted values for initial claims and continuing claims, have been revised."
Haver Analytics will stop seasonally adjusting US claims data as we expect the revised Labor Department data to closely align with our adjusted series. We will continue to adjust state claims.
Data on weekly unemployment claims going back to 1967 are contained in Haver's WEEKLY database, and they are summarized monthly in USECON. Data for individual states are in REGIONW. The expectations figure is from the Action Economics Forecast Survey, carried in the AS1REPNA database.
| Unemployment Insurance (SA, 000s) | 03/27/21 | 03/20/21 | 03/13/21 | Y/Y % | 2020 | 2019 | 2018 |
|---|---|---|---|---|---|---|---|
| Initial Claims | 719 | 658 | 765 | -88 | 1,352 | 218 | 220 |
| Initial Claims (NSA) | 714 | 651 | 757 | -88 | 1,353 | 218 | 221 |
| Initial Claims Pandemic Unemployment Assistance (NSA) | 237 | 241 | 284 | -- | -- | -- | -- |
| Continuing Claims | -- | 3,794 | 3,840 | 23 | 10,380 | 1,699 | 1,754 |
| Continuing Claims (NSA) | -- | 4,143 | 4,234 | 21 | 10,370 | 1,704 | 1,763 |
| Continuing Claims Pandemic Unemployment Assistance (NSA) | -- | -- | 7,350 | -- | -- | -- | -- |
| Insured Unemployment Rate (%) | -- | 2.7 | 2.7 |
3.0 |
7.1 | 1.2 | 1.2 |
Kathleen Stephansen, CBE
AuthorMore in Author Profile »Kathleen Stephansen is a Senior Economist for Haver Analytics and an Independent Trustee for the EQAT/VIP/1290 Trust Funds, encompassing the US mutual funds sponsored by the Equitable Life Insurance Company. She is a former Chief Economist of Huawei Technologies USA, Senior Economic Advisor to the Boston Consulting Group, Chief Economist of the American International Group (AIG) and AIG Asset Management’s Senior Strategist and Global Head of Sovereign Research. Prior to joining AIG in 2010, Kathleen held various positions as Chief Economist or Head of Global Research at Aladdin Capital Holdings, Credit Suisse and Donaldson, Lufkin and Jenrette Securities Corporation.
Kathleen serves on the boards of the Global Interdependence Center (GIC), as Vice-Chair of the GIC College of Central Bankers, is the Treasurer for Economists for Peace and Security (EPS) and is a former board member of the National Association of Business Economics (NABE). She is a member of Chatham House and the Economic Club of New York. She holds an undergraduate degree in economics from the Universite Catholique de Louvain and graduate degrees in economics from the University of New Hampshire (MA) and the London School of Economics (PhD abd).
More Economy in Brief
 Global| Feb 05 2026
Charts of the Week: Balanced Policy, Resilient Data and AI Narratives
by:Andrew Cates


