 Global| Sep 17 2020
U.S. Initial Jobless Claims Decline; Continuing Claims Range-bound
Summary
• Seasonally adjusted state initial claims declined to 860,000 in the week ending September 12. Not seasonally adjusted state initial jobless claims down to 790,021. • While all measures of state initial claims are at their lowest [...]
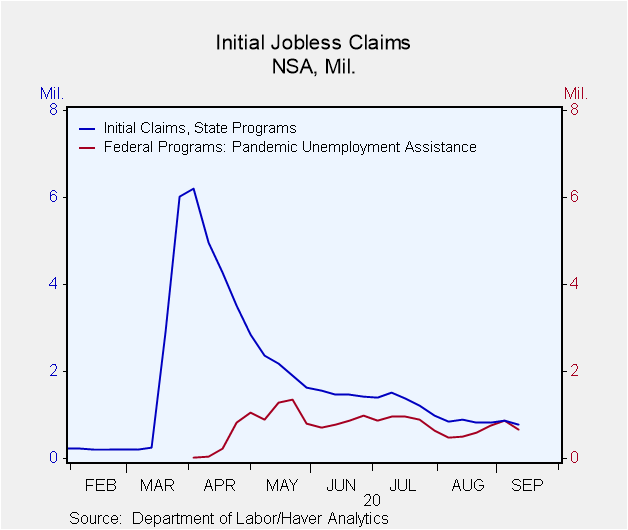
• Seasonally adjusted state initial claims declined to 860,000 in the week ending September 12. Not seasonally adjusted state initial jobless claims down to 790,021.
• While all measures of state initial claims are at their lowest level since March 21, Haver methodologically-consistent history seasonally adjusted claims just slightly below levels seen in August.
• Federal Pandemic Unemployment Assistance new filers decreased to 658,737 following four consecutive monthly increases.
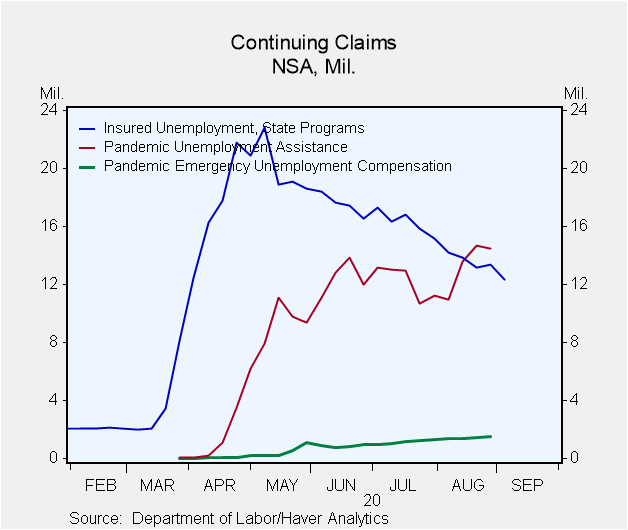
• Total of state, PUA and PEUC continuing claims at 28.3 million; range-bound since May.
Seasonally adjusted state initial jobless claims for unemployment insurance declined to 860,000 in the week ending September 12 from 893,000 in the previous week. The Action Economics Forecast Survey anticipated 850,000. A change in the calculation of seasonal adjustment factors created a break in the series three weeks ago; though the current week-to-week comparison is valid. For more details please see the September 3 commentary on jobless claims.
The not seasonally adjusted data, which is comparable across all periods for initial claims rose to 790,021 in the week ending September 12 from 865,995. Haver Analytics has calculated methodologically consistent seasonally adjusted data. This shows claims edging down to 869,000 from 894,000. As this data illustrates, our calculated seasonal adjustment factors closely match the Department of Labor (DoL) seasonals. However, there are some gaps between the seasonal adjustment factors released by the DoL for the remainder of the year and our estimated factors. While all measures of state initial claims are at their lowest level since March 21, Haver methodologically-consistent history is just slightly below the 863,000 level from August 22.
Claims for the federal Pandemic Unemployment Assistance (PUA) program, which covers individuals such as the self-employed who are not qualified for regular/state unemployment insurance, decreased for the first time in four weeks to 658,737 from 868,314. PUA claims are up roughly 170,000 since their near-term low in the week ending August 8. Numbers for this and other federal programs are not seasonally adjusted.
Seasonally adjusted state continuing claims for unemployment insurance fell to 12.628 million in the week ending September 5, from 13.544 million. This week-to-week comparison uses the same seasonal adjustment methodology. Not seasonally adjusted continuing claims dropped to 12.321 from 13.355 million. Haver Analytics methodologically consistent seasonally adjusted continuing claims decreased to 12.645 million from 13.545 million.
Continuing PUA claims, which are lagged an additional week and not seasonally adjusted, declined to 14.467 million from 14.656 million. Still they are up 3.5 million from the near-term low of 11.0 million in early August. Pandemic Emergency Unemployment Compensation claims continued their upward climb to a new high of 1.527 million in the week ending August 29. This program covers people who were unemployed before COVID but exhausted their state benefits and are now eligible to receive an additional 13 weeks of unemployment insurance, up to a total of 39 weeks.
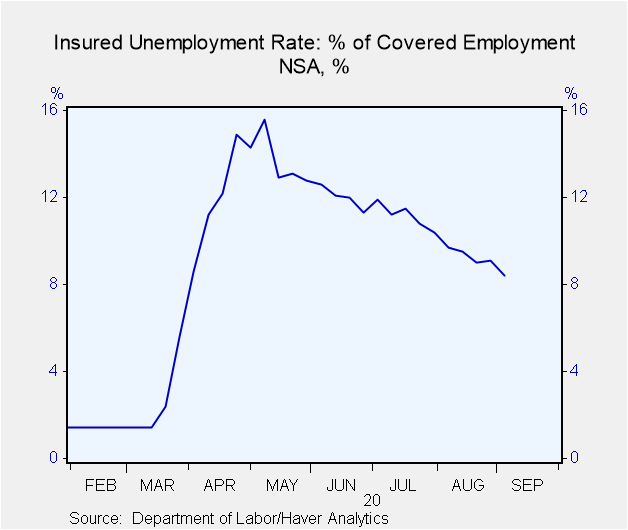
The seasonally adjusted state insured rate of unemployment fell to 8.6% in the week ending September 5 from 9.3%. The not-seasonally-adjusted data dropped to 8.4% from 9.1%. This data does not include the federal pandemic assistance programs. If you include the latest data available, which is lagged one additional week, the total number of state, PUA and PEUC continuing claims declined to 28.3 million or 17.6% of the labor force. This total has been range-bound since May.
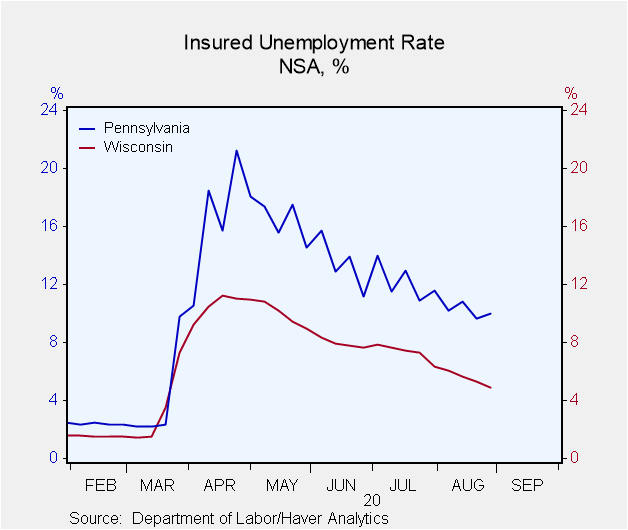
The state insured rates of unemployment -- which do not include federal programs -- continued to show wide variation with Idaho at just 1.8% and Hawaii at 20.3%. Eleven states had rates above 10%, with Hawaii the only state above 20%. The largest states ranged between 4.7% for Florida and 17.3% for California. The state rates are not seasonally adjusted.
Data on weekly unemployment claims going back to 1967 are contained in Haver's WEEKLY database, and they are summarized monthly in USECON. Data for individual states are in REGIONW. The expectations figure is from the Action Economics Forecast Survey, carried in the AS1REPNA database.
| Unemployment Insurance (SA, 000s) | 09/12/20 | 09/05/20 | 08/29/20 | Y/Y % | 2019 | 2018 | 2017 |
|---|---|---|---|---|---|---|---|
| Initial Claims | 860 | 893 | 884 | 308 | 218 | 221 | 244 |
| Initial Claims (NSA) | 790 | 866 | 837 | 356 | 218 | 221 | 243 |
| Initial Claims Pandemic Unemployment Assistance (NSA) | 659 | 868 | 751 | -- | -- | -- | -- |
| Continuing Claims | -- | 12,628 | 13,544 | 654 | 1,701 | 1,756 | 1,961 |
| Continuing Claims (NSA) | -- | 12,321 | 13,355 | 740 | 1,704 | 1,763 | 1,964 |
| Continuing Claims Pandemic Unemployment Assistance (NSA) | -- | -- | 14,467 | -- | -- | -- | -- |
| Insured Unemployment Rate (%) | -- | 8.6 | 9.3 |
1.2 |
1.2 | 1.2 | 1.4 |
Gerald D. Cohen
AuthorMore in Author Profile »Gerald Cohen provides strategic vision and leadership of the translational economic research and policy initiatives at the Kenan Institute of Private Enterprise.
He has worked in both the public and private sectors focusing on the intersection between financial markets and economic fundamentals. He was a Senior Economist at Haver Analytics from January 2019 to February 2021. During the Obama Administration Gerald was Deputy Assistant Secretary for Macroeconomic Analysis at the U.S. Department of Treasury where he helped formulate and evaluate the impact of policy proposals on the U.S. economy. Prior to Treasury, he co-managed a global macro fund at Ziff Brothers Investments.
Gerald holds a bachelor’s of science from the Massachusetts Institute of Technology and a Ph.D. in Economics from Harvard University and is a contributing author to 30-Second Money as well as a co-author of Political Cycles and the Macroeconomy.
More Economy in Brief
 Global| Feb 05 2026
Charts of the Week: Balanced Policy, Resilient Data and AI Narratives
by:Andrew Cates


