 Global| Mar 25 2021
U.S. Initial Jobless Insurance Claims Fall 97,000
Summary
• PUA initial claims decline in March 20 week. • Continuing claims in regular state programs reach lowest since mid-March 2020. • Insured jobless rate declines to lowest since pandemic set in. Initial claims for unemployment insurance [...]
• PUA initial claims decline in March 20 week.
• Continuing claims in regular state programs reach lowest since mid-March 2020.
• Insured jobless rate declines to lowest since pandemic set in.
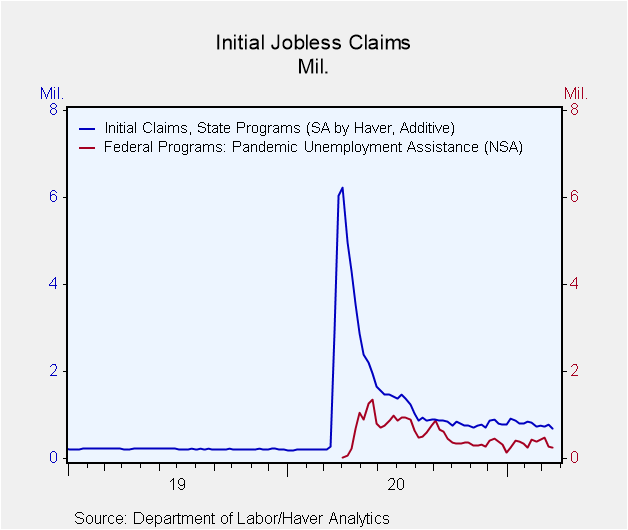
Initial claims for unemployment insurance were 684,000 in the week ended March 20, a decline of 97,000 from the previous week; that week's claims were revised modestly to 781,000 from 770,000 initially reported. The Action Economics Forecast Survey had expected 738,000 initial claims for the latest week. The four-week moving average of initial claims eased to 736,000 from 749,000; by a small margin, this was the lowest four-week average since March 14, 2020, just as the pandemic effects were setting in.
Initial claims for the federal Pandemic Unemployment Assistance (PUA) program were 241,745 in the March 20 week, down 42,509 from the week before. These initial claims do move relatively widely from week to week. The PUA program covers individuals such as the self-employed who are not included in regular state unemployment insurance. Given the brief history of this program, which started April 4, 2020, these and other COVID-related series are not seasonally adjusted.
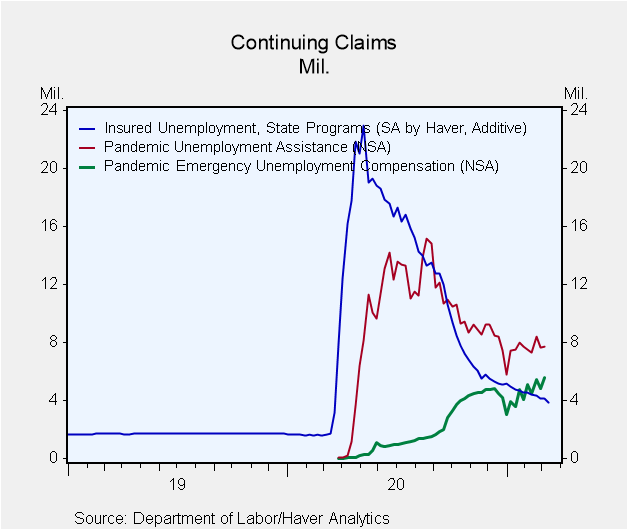
Continuing claims for regular state unemployment insurance fell to 3.870 million in the week ended March 13 from 4.134 million in the prior week, revised from 4.124 million. Continuing PUA claims for the week of March 6 rose 118,898 to 7.735 million from 7.617 million the prior week. The number of Pandemic Emergency Unemployment Compensation (PEUC) claims also rose in that week, reaching 5.551 million, a new high, from 4.817 million the week before. That program covers people who were unemployed before COVID but exhausted their state benefits. An extension of the PEUC benefits was included in the American Rescue Plan bill passed by the Congress earlier this month, and they will now be available until August 29.
The total number of all state, federal and PUA and PEUC continuing claims rose 733,862 in the March 6 week to 18.953 million from 18.219 million week before. This grand total is not seasonally adjusted.
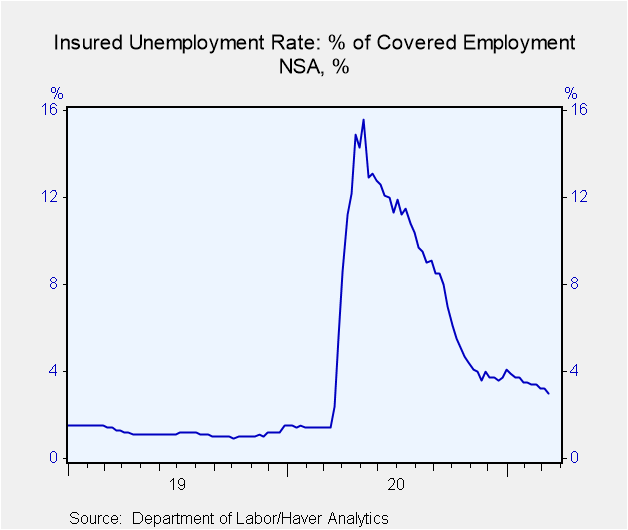
The seasonally adjusted state insured rate of unemployment fell to 2.7% in the March 13 week from 2.9% the prior week. The latest was a new low since 2.1% the week of March 21, 2020, just when the pandemic's impact was starting to be evident.
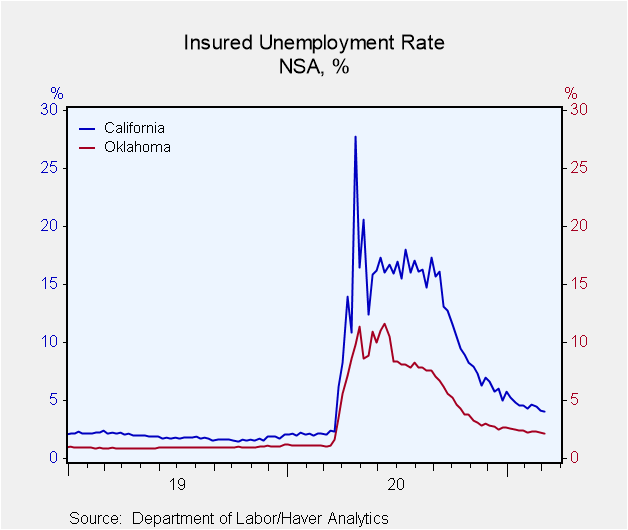
The state insured rates of unemployment continued to show wide variation. In the week ended March 6, the highest rates were in Connecticut (4.83%), New York (4.88%), Alaska (5.29%), Nevada (5.37%) and Pennsylvania (5.75%). The lowest rates were in Alabama (0.88%), Utah (0.99%), South Dakota (1.20%), North Carolina (1.32%) and Nebraska (1.39%). We often highlight the most populous states and a couple of them are shown here with their high rates. In addition, California's rate is 4.01%, that for Texas is 2.95% and Florida, 1.59%. These state rates are not seasonally adjusted.
As we continue to point out, the Labor Department changed its seasonal adjustment methodology back in August from multiplicative to additive. They did not restate the earlier data, so there is a break in the series in late August. Though the current comparison to early September is valid, comparisons with figures before August 22 are not. Haver Analytics has calculated methodologically consistent seasonally adjusted claims series dating back to 1979. This series matches the Department of Labor seasonally adjusted series since their change in methodology. For more details, please see the September 3 commentary on jobless claims.
Data on weekly unemployment claims going back to 1967 are contained in Haver's WEEKLY database, and they are summarized monthly in USECON. Data for individual states are in REGIONW. The expectations figure is from the Action Economics Forecast Survey, carried in the AS1REPNA database.
| Unemployment Insurance (SA, 000s) | 03/20/21 | 03/13/21 | 03/06/21 | Y/Y % | 2020 | 2019 | 2018 |
|---|---|---|---|---|---|---|---|
| Initial Claims | 684 | 781 | 725 | -79 | 1,450 | 218 | 221 |
| Initial Claims (NSA) | 657 | 757 | 722 | -78 | 1,367 | 218 | 221 |
| Initial Claims Pandemic Unemployment Assistance (NSA) | 242 | 284 | 479 | -- | -- | -- | -- |
| Continuing Claims | -- | 3,870 | 4,134 | 117 | 10,664 | 1,701 | 1,756 |
| Continuing Claims (NSA) | -- | 4,217 | 4,496 | 103 | 10,358 | 1,704 | 1,763 |
| Continuing Claims Pandemic Unemployment Assistance (NSA) | -- | -- | 7,735 | -- | -- | -- | -- |
| Insured Unemployment Rate (%) | -- | 2.7 | 2.9 |
2.9 |
7.3 | 1.2 | 1.2 |
Carol Stone, CBE
AuthorMore in Author Profile »Carol Stone, CBE came to Haver Analytics in 2003 following more than 35 years as a financial market economist at major Wall Street financial institutions, most especially Merrill Lynch and Nomura Securities. She had broad experience in analysis and forecasting of flow-of-funds accounts, the federal budget and Federal Reserve operations. At Nomura Securities, among other duties, she developed various indicator forecasting tools and edited a daily global publication produced in London and New York for readers in Tokyo. At Haver Analytics, Carol was a member of the Research Department, aiding database managers with research and documentation efforts, as well as posting commentary on select economic reports. In addition, she conducted Ways-of-the-World, a blog on economic issues for an Episcopal-Church-affiliated website, The Geranium Farm. During her career, Carol served as an officer of the Money Marketeers and the Downtown Economists Club. She had a PhD from NYU's Stern School of Business. She lived in Brooklyn, New York, and had a weekend home on Long Island.
More Economy in Brief
 Global| Feb 05 2026
Charts of the Week: Balanced Policy, Resilient Data and AI Narratives
by:Andrew Cates


