 Global| Dec 29 2011
U.S. Initial Unemployment Claims Turn Up in Dec 24 Week
Summary
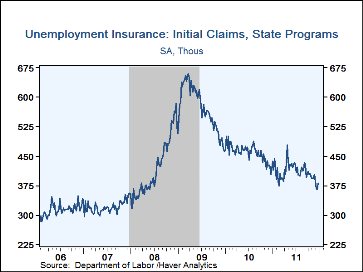
Initial claims for unemployment insurance rose back to 381,000 in the week ended December 24 from 366,000 the week before (revised from 364,000). Expectations had been for a smaller rise to 374,000 in the Action Economics survey. [...]
 Initial claims for unemployment insurance rose back to 381,000 in the week
ended December 24 from 366,000 the week before (revised from 364,000).
Expectations had been for a smaller rise to 374,000 in the Action Economics
survey. However, the 4-week moving average still fell and reached 375,000, the
lowest since June 7, 2008.
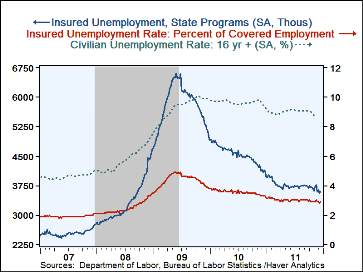
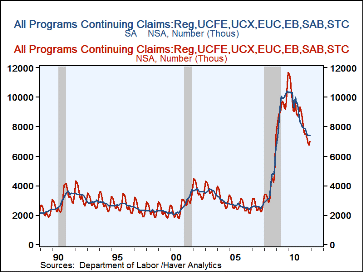
Continuing claims for unemployment insurance rose modestly in the December 17th week, from 3,567,000 to 3,601,000. The insured unemployment rate ticked back up from 2.8% to 2.9%. This particular count covers only "regular" programs and does not include all extended benefit and other specialized programs. Thus, in the December 10 week (the latest reported today), the grand total of all benefit recipients was 7,232,000; this compares to 7,152,000 and 7,450,000 in the preceding two weeks. All three of these recent readings represent some reversal of a declining trend that had been in place nearly all of this year. These items are, however, not seasonally adjusted, and they appear to repeat a pattern that also appeared in late 2008, 2009 and 2010, so the current movement may represent more seasonal force than fundamental economic development.
A view of these total beneficiaries aggregated to monthly shows the strong season pattern, all the more evident in the seasonal adjustment function available in Haver's DLXVG3 software. The last three years show a move from an implied seasonal factor of about 94% in November to about 106% in December. This has moved up another 8 percentage points or so in January. So if any retreat appears in the actual reported numbers of claimants in coming weeks -- or if they were to even stabilize -- it would be a very encouraging sign.
Data on weekly unemployment insurance programs are contained in Haver's WEEKLY database, including the seasonal factor series, and they are summarized monthly in USECON. Data for individual states, including the unemployment rates that determine individual state eligibility for the extended benefits programs and specific "tiers" of the emergency program, are in REGIONW, a database of weekly data for states and various regional divisions. Action Economics consensus estimates are in AS1REPNA.
| Unemployment Insurance(000s) | 12/24/11 | 12/17/11 | 12/10/11 | Y/Y% | 2010 | 2009 | 2008 |
|---|---|---|---|---|---|---|---|
| Initial Claims | 381 | 366 | 368 | -5.7 | 461 | 577 | 413 |
| Continuing Claims | -- | 3,601 | 3,567 | -13.1 | 4,544 | 5,807 | 3,338 |
| Insured Unemployment Rate (%) | -- | 2.9 | 2.8 | 3.3 (12/10) |
3.6 | 4.4 | 2.5 |
| Total "All Programs" (NSA) | -- | -- | 7.232M | -18.3 | 9.850M | 9.163M | 3.903M |
Carol Stone, CBE
AuthorMore in Author Profile »Carol Stone, CBE came to Haver Analytics in 2003 following more than 35 years as a financial market economist at major Wall Street financial institutions, most especially Merrill Lynch and Nomura Securities. She has broad experience in analysis and forecasting of flow-of-funds accounts, the federal budget and Federal Reserve operations. At Nomura Securites, among other duties, she developed various indicator forecasting tools and edited a daily global publication produced in London and New York for readers in Tokyo. At Haver Analytics, Carol is a member of the Research Department, aiding database managers with research and documentation efforts, as well as posting commentary on select economic reports. In addition, she conducts Ways-of-the-World, a blog on economic issues for an Episcopal-Church-affiliated website, The Geranium Farm. During her career, Carol served as an officer of the Money Marketeers and the Downtown Economists Club. She has a PhD from NYU's Stern School of Business. She lives in Brooklyn, New York, and has a weekend home on Long Island.


